🌿 The Good Sperm 💦
Understanding semen analysis values based on recent WHO research.
Movember Men's Health special, Part 3
In 2009, the World Health Organisation published a paper entitle “World Health Organisation reference values for human semen characteristics”. The purpose of the research was to not only determine normal ranges for fertility, but also to determine the best sample populations to gauge the best reference values.

This research was based around semen samples from 1400 men from 14 countries. The men were separated into four categories:
- fathers with a time-to-pregnancy (TTP) of less than or equal to 12 months,
- unscreened men from the general population,
- fathers with no known time-to-pregnancy (TTP),
- screened men with normozoospermia ('normal' sperm).
It was decided that the most obvious choice of population to determine the reference values (at least for the purposes of fertility) would be to look at the population of men who had fathered a child in 12 months or less.
The reference values were then determined, and plotted in a box-and-whisper graph (similar to a bell curve). The other populations are shown in the graphic below as a comparison. Fathers with a TTP of less than/equal to 12 months are shown in black.
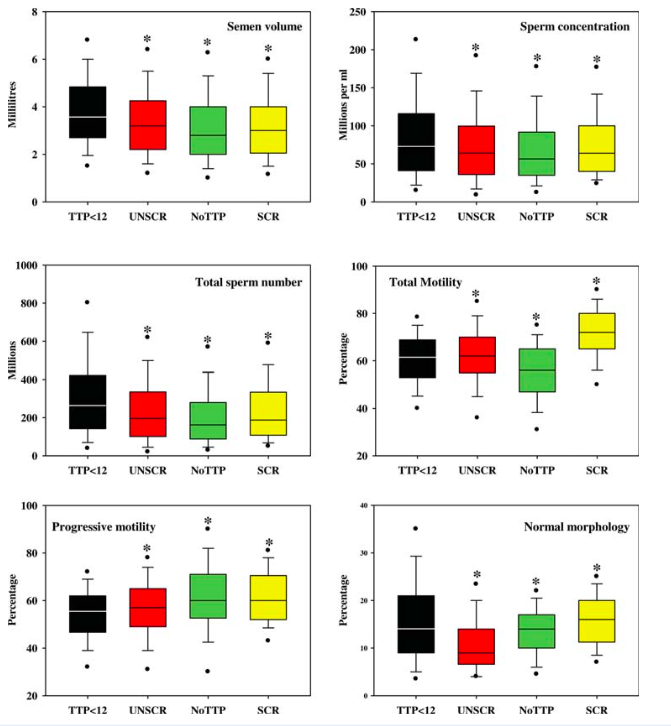
Figure 1: Box and whisker plots of semen analysis data. Semen volume, sperm concentration, total sperm numbers per ejaculate, total percentage motility, percentage progressive motility and percentage normal morphology from fathers with time-to-pregnancy ≤12 months (TTP , <12, black), unscreened men from the general population (UNSCR, red), fathers with no known time-to-pregnancy (NoTTP, green) and screened men selected for normozoospermia (SCR, yellow). The boxes represent the quartiles and the lines within them are the medians; the whiskers extend from the 10th to the 90th centiles and the dots represent the 5th and 95th centiles. Significantly different from fathers with TTP ≤12 months.
What this box-and-whisper plot shows are values in the context of the reference values, and their spread amongst the population studied. The black dots show the value of the 5th and 95th centile, the whisker-lines represent the 10th and 90th centiles, the boxes represent the quartiles (25th–75th centiles), and the line represents the median range, or the 50th centile.
A centile (or a percentile) is a measure used in statistics indicating the value below which a given percentage of observations in a group of observations fall. For example, the 20th percentile is the value (or score) below which 20% of the observations may be found. The 25th percentile is also known as the first quartile (Q1), the 50th percentile as the median, or second quartile (Q2), and the 75th percentile as the third quartile (Q3).
In the above, the median ranges for sperm values are as follows:
- Semen volume: 3.2ml
- Sperm concentration: 64 million per ml
- Total sperm number: 196 million per ejaculate
- Total motility: 62%
- Progressive motility: 57%
- Normal morphology: 14%
For those men that spontaneously fathered a child within a 12 month period, most men (the 25th– 75th centile) fell within the ranges as follows:
- Semen volume: 2.2–4.2ml
- Sperm concentration: 36–100 million per ml
- Total sperm number: 101–336 million per ejaculate
- Total motility: 55–70%
- Progressive motility: 49–65%
Normal morphology: 10.5–16%
The lower reference values have been based on the 5th centile ranges; these are the values you will find on standard sperm tests done at local pathology labs, unlike those done at speciality andrology labs. This essentially means that if your sperm tests show morphology to be 4% normal forms, it means you are in the lowest 5% of what is considered normal.
In other words, far more men spontaneously fathered a child within 12 months with higher ranges of sperm values, than they did with sperm values equal to the lower reference values!
Further, in a discussion on the relevance of reference ranges, it was discussed that using value ranges as an end-point of a diagnosis of 'male infertility' is futile, and that in a clinical setting, the sperm test analysis needs to be incorporated into the bigger picture – alongside the fecundity of the female partner – of why a couple is having difficulties conceiving.
The question that a fertility specialist needs to ask is what is the contribution of these sperm variables to the multi-factorial condition of inability to conceive. As the authors of that study state, “a man's semen characteristics need to be interpreted in conjunction with his clinical information.”
Why are these important for you?
There has only ever been one report (not research) published in 1997 claiming that high sperm count or percentages of progressively motile or morphologically normal sperm are harmful to fertility. It is surprising that there is still a general view that the inability to conceive must always be due to the factors involving the female. The reality is that it is both sperm and egg together that must join and create the spark of life.
It makes sense to many why good values for sperm concentration and motility are necessary for the ability to conceive. But what about morphology?

Morphology refers specifically to the shape of the head of the sperm. The shape of the head is important for two reasons: this is the part that needs to penetrate the egg; secondly, it stores your DNA, the genetic gift you impart to your child. If the genetic information is compromised, this will affect the viability of the foetus; it is currently thought that around a third of miscarriages are due to male factors — inevitably problems with the quality of the sperm that fertilised the egg.
What do you need to do?
If you and your partner are trying to have children, and nothing is happening, go see a natural health practitioner with expertise and experience in fertility. Both of you!
For men, it's really important to consult with someone who understands how to read sperm analysis, and to get any semen analysis performed by specialist andrology labs. Unfortunately, General Practitioners do not understand how to interpret semen analysis data properly, and will tell men their sperm is fine when their results show them to be in the lower 5th percentile range.
This is just plain wrong, as the research above shows clearly. So guys, don't just expect your partner to go through all the tests and treatment when there is so much more you can be doing to improve your chances of natural, easy, (and fun) conception.
MADE FOR STEEMIT

CREATE YOUR OWN @REVIEWME PROFILE TO START EARNING CREDIBILITY STARS FROM THE COMMUNITY!
CREATING YOUR PROFILE IS EASY! JUST FOLLOW THE STEPS HERE ☜(ˆ▿ˆc)

It is refreshing to see someone focusing on the male aspect of fertility/infertility. Morphology seriously plays a huge role in whether or not a sperm is healthy. I am a little bit confused though, are you saying that having more sperm is unhealthy?
Not sure that’s what I’m saying... if I’ve written something that suggests that, then I apologise for sloppy writing.
I mentioned that there was a report that claimed that more sperm was not good, but I read that report and there was no evidence to back those claims up.
The box-and-whisper graph merely shows results based on those tested.
Posted using Partiko iOS
Ah, okay - I thought that’s what you were saying but it came off a little unclear. Thanks for clarifying.