Europe music map
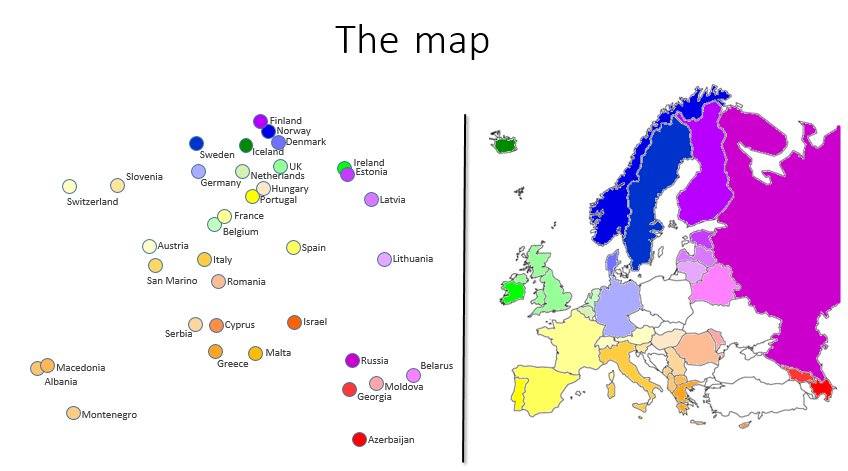
Did you ever wonder what the European map would look like if the nations were located based on cultural taste, rather than geographical distance? Which countries would be your neighbours? Which countries would be located in the centre of Europe and which would be in the outskirts? Where can the most unique taste be found and are there any taste clusters? Do the preferences in wealthier countries differ from that in poorer? We have tried to answer these questions by using the votes from four of the most recent Eurovision Song Contests (2012-2015) to compile “the Eurovision music map”.

Music preference (left) and geographic location (right) of all countries that participated in the Eurovision Song Contest during the years 2012 to 2015. The two neighbouring countries that differ the most are Finland and Russia. Despite Iceland’s remote geographic location, it is closely related in taste to its neighbours.
The music of the East and West
To answer the question of whether the music taste in Eastern Europe differ from that in the Western part, the country dots have been coloured red or blue, respectively. The grouping into East and West follows the block definition from the days of the Cold War.

The taste in “Eastern Europe” generally seem to differ from that in the classic Western countries. There are however some exceptions. Slovenia, Hungary and the Baltic countries place their votes in a similar way as the West, while the taste in Greece seem to be quite typical to the preferences in the “East”.
Gross Domestic Product and music taste
In order to investigate if the music taste in wealthier countries differ from the taste in poorer, we have gathered information on the Gross Domestic Product (GDP) of all countries. Instead of geographic location, the taste plot has then been updated to show GDP per capita. The relative size of the dots illustrates the wealth of the different countries.

Countries with high GDP per capita generally appear to differ in their music preferences compared to poorer countries. An exception is for example Hungary with a taste similar to UK and the Netherlands. Israel, on the other hand, have a musical preference similar to Malta and Russia. Note that the overall pattern highly resembles the East and West geographic division (Figure 2), since there is a correlation between the former political and economic system and the current wealth of a nation.
The core of the European music taste
The average or “core taste” among the participating European countries can be found by placing an archery target board over the taste plot (Figure 4), with the calculated mean of all votes representing the bullseye.

The country with the most typical European taste, i.e. closest to the bullseye, is Romania. Albania, on the contrary, is located furthest from the centre of the plot, and can thus be interpreted as having the most unique music preference of the analysed countries. The complete ranking, listed from the centre and outwards, is found in the text box.
Taste clusters
The groups of countries that are located furthest from each other in the taste plot are marked in Figure 5 as three separate clusters. These three clusters have the most extreme music preferences and hence they differ the most.

The three taste clusters are the Nordic countries, some of the Ex-Soviet countries, and some of the former Yugoslavian countries.
Method
The votes in the Eurovision Song Contest (ESC) have been used to calculate the distances between the country dots in the plot. For every pair of dots, the average score when giving points to a third country has been calculated. Country pairs with low or high average differences end up close and far away, respectively. Data from the last four contests have been used (2012-2015), and only countries that have participated during all of these years are included in the analyses.
The distance, D, between country dots A and B is calculated by the formula below, where a and b is the score given by country A and B, respectively, to country i. i represents all individual countries except A and B.

Below follows a theoretical example of the placing of country dots A, B and C. The score distribution between these countries, and the additional country D, is as follows:

If you have any feedback or questions, feel free to cemment!
/Raymond Beele
Great article
Super post
Great article
Congratulations @raymondbeele! You have received a personal award!
Click on the badge to view your Board of Honor.
Do not miss the last post from @steemitboard!
Participate in the SteemitBoard World Cup Contest!
Collect World Cup badges and win free SBD
Support the Gold Sponsors of the contest: @good-karma and @lukestokes
Congratulations @raymondbeele! You received a personal award!
You can view your badges on your Steem Board and compare to others on the Steem Ranking
Vote for @Steemitboard as a witness to get one more award and increased upvotes!