Where Are The QQQs Heading Next???
Invesco QQQ is an exchange-traded fund based on the Nasdaq-100 Index. QQQs is one of the most traded ETFs in the world and includes 100 of the largest domestic and international nonfinancial companies listed on the Nasdaq Stock Market based on market capitalization.
The QQQs are having their worst month in three years at this point. Roughly, 60% of the fund is devoted to the technology space. In particular the FANG stocks make up about 50% of the QQQs and are all down significantly thus far in October.
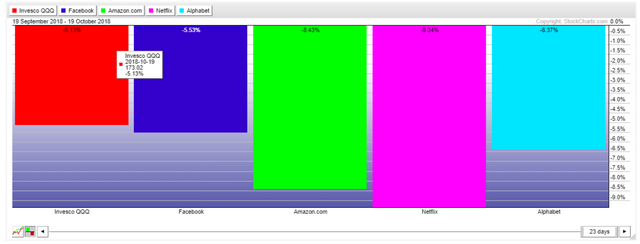
It didn’t help that Netflix gapped higher after earnings to only go much lower that day. Netflix posted third quarter earnings of $0.89 per share compared to $0.29 per share during the third quarter of 2017. Earning and subscriber growth beet analyst estimates, but after gapping up, Netflix sold off throughout the day, eventually closing a lot lower for the day. Although Netflix makes up only 2% of QQQs, the gap up and the close significantly lower that day is was a clear sign that sentiment is still negative in Tech land.
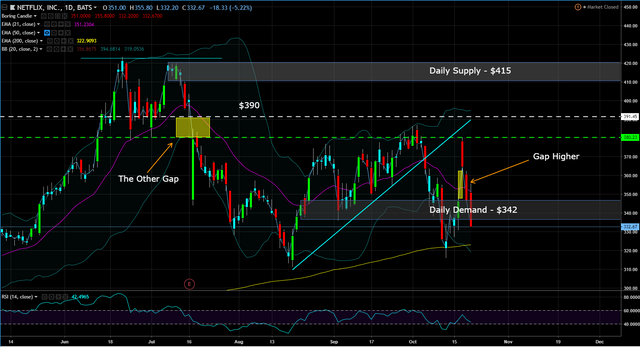
NOTE: so much for filling the other gap.
Over the last four weeks, the fund has posted outflows of $469.4 million. For comparison purposes, over the last year, inflows have been $5,087.0 million. So to quantify the inflows and outflows, even though the QQQs are having their worst October so for in three years, the QQQ is still up 44% in three years.
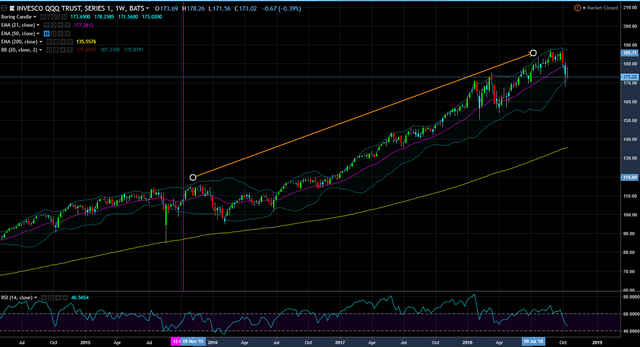
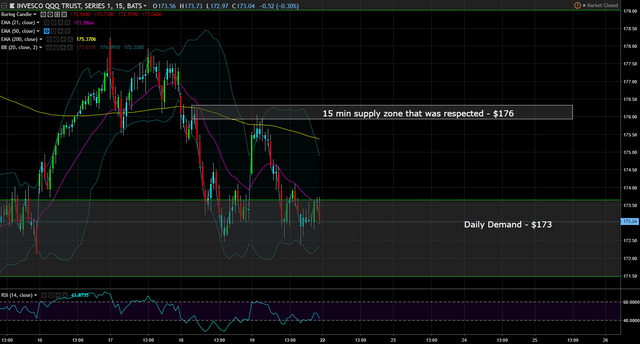
So where are the QQQs heading next, lets go to the chart to find out. If you follow my posts, you know I stay on the higher timeframe charts, but today, I examination of the road blocks on the smaller timeframes as well.
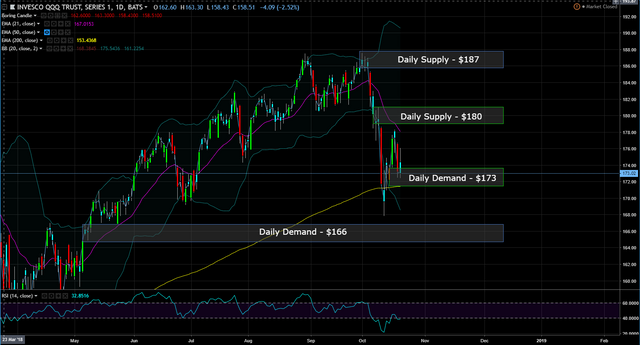
The range on the daily chart is the daily demand at $166 and daily supply at $187.
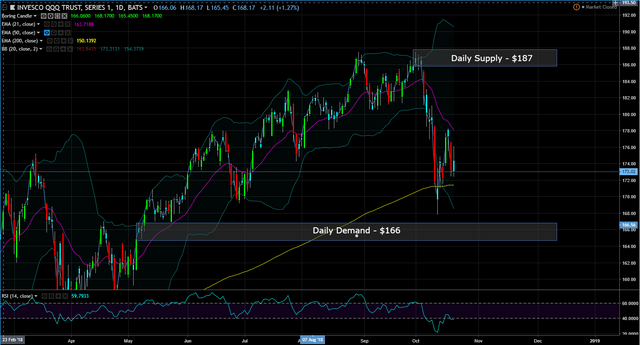
Price has already reacted to the daily demand in the middle of the range, so I would not consider this level demand again if price returns to this level.
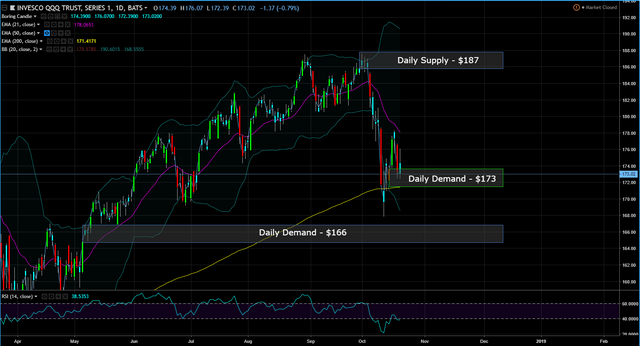
The next level that price will have to contend with is the daily supply at $180.
On the 15 min chart, I just see more supply zones than demand zones
Another 15 min supply zone,
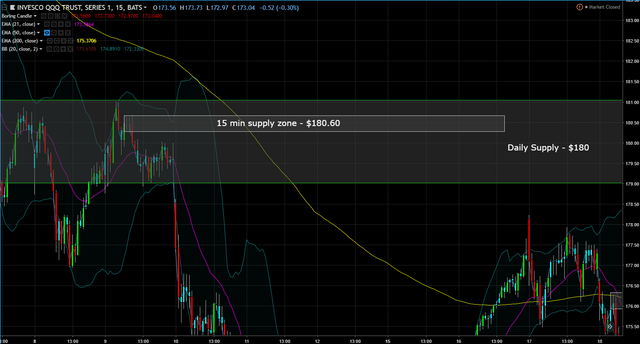
Yet more 15 min supply zone,
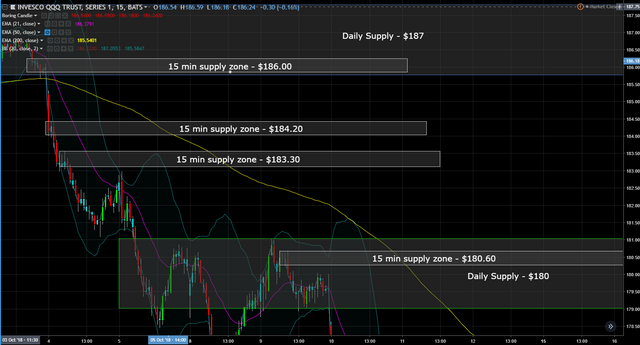
The chart on the smaller timeframe tells me there is still more downside risks, based on the abundance of supply zones and lack of demand zone. However, 10/24 and 10/25 will be decision day as Microsoft, Google and Amazon are scheduled to report their earnings.
This post is my personal opinion. I’m not a financial advisor, this isn't financial advise. Do your own research before making investment decisions.

Published on

by rollandthomas

I could see use getting to that 166 demand level. Alot of sectors are weak right now. I'd be surprised if we push up towards the highs again this year.
Definitely will be lower. The lows ar enot in yet and likely will happen this week. IWM is already in the killzone area about to wreck the longs and will drag down the QQQ and SPY