📈 True Profitable Cryptocurrency Trading 💰 - [RESEARCH PT 1.]

I haven’t been talking much about cryptocurrencies lately as you might have seen I mostly talked about politics lately, that is because I have been working on a trading strategy for the past month and a half.
I may have been wrong about BTC as I have predicted a decline (which I still believe it might come) but of course it shot up to 10,000$, so that was a wrong prediction.
Now I haven’t really made many trades since then, I had a couple skirmishes with Ethereum, but that’s about it, because I was working on a profitable trading strategy, mostly for Ethereum and Monero.
I figured that guessing the price is not exactly accurate, so why not have a quantitative strategy that guarantees to be profitable, with a reasonable accuracy, and that is what I did.
The True Profitable Strategy
Now I had some trading strategies in the past, but I was sloppy back then, I didn’t have a thorough analysis back then as what I have now. I worked on this for the past 1.5 months, and I think I found a pretty profitable one, which can be quantified and statistically proven to be profitable.
It’s not just simply profitable, but it’s also adaptive and simplistic so that the variance of the parameters is low. I mean we want an adaptive strategy so that we don’t need to recalculate the parameters that often.
Obviously if the variance of the parameters is high, then the strategy is worthless as it doesn’t say anything about the future either, so it will guaranteed to be unprofitable. Let me give you an example:
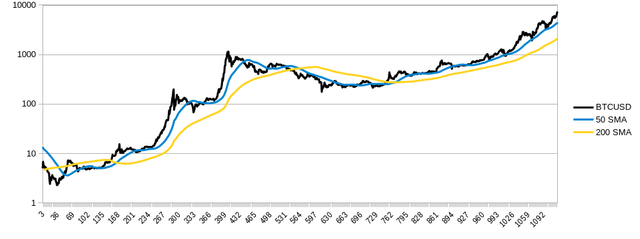
Non-Adaptive Strategy
So the best example for a non-adaptive strategy is 2 moving averages. Let’s say you have 2 simple moving averages, the most common method is say a 50 SMA and a 200 SMA.
So let’s say you BUY when the 50 SMA > 200 SMA and SELL when the 50 SMA<= 200 SMA.
Pretty simple strategy, now this is static. Obviously it won’t be good.
So then you move on and figure out the best parameters X SMA > Y SMA for BUY and X SMA<= Y SMA. So you look for a [X,Y] pair that will be the most profitable.
So for the sake of the example let’s say the most profitable one is [X=60 , Y =273]. So now you have the most profitable SMA crossover strategy, and you backtest it and the profits will be amazing on the historical data.
But there is a high probability that it won’t work on the future, you know the classic slogan “past performance doesn’t indicate future performance”.
Yes this method is non-adaptive, simply because you have curve-fitted the parameters to a certain dataset, and there is no reason why these parameters should be “sticky” for future data as well.
So this strategy is a high-variance parameter setup because the variance of the optimal parameters might change pretty quickly, for N+1 datapoint it might be [57,305] or [43,321] or any other combination around that range, essentially random, and there is absolutely no guarantee that the [60,273] parameters will stick to the future data.
This method is guaranteed to be unprofitable for future data! You might as well just be better of by random guessing than using a strategy that can’t adapt itself!
Adaptive Strategy
So obviously I have been working on an adaptive strategy, that does guarantee profitability for future data from the historical dataset. It’s very easy to prove that by running a Monte Carlo simulation on different random chunks of random length and random start and endpoint of the dataset.
Obviously the SMA crossover method described above will totally fail this test. But my adaptive strategy doesn’t.
Of course there is always a probability that the parameters are unoptimal, but the probability of that will be small, and the average end result of the Monte Carlo simulation has to be a positive expectancy.
There is always a principle of simplicity which applies to time series analysis, so that the most simple strategy is the most reliable one.
This also means that 1 parameter set has to have a long “expiration date”. We should expect 1 set of parameters to give profitable results for the most Monte Carlo chunks of random length. Thus the subset has to converge towards the set in most cases. So that even if we pick the worst subset, we should be able to make profit in most cases. This eliminates a lot of arbitrary inputs, and makes the strategy very adaptive on it’s own.
The sample size of the Monte Carlo simulation is 10,000, which took me 2 hours to compute, here are the results:
Basically the data size is 840 size big and it needs about 10 datapoints to initialize itself and leaving about minimum 10 points to run, so minimum 20 points, so we have 10,000 random chunks between [x=0,y=840] where y-x>20:
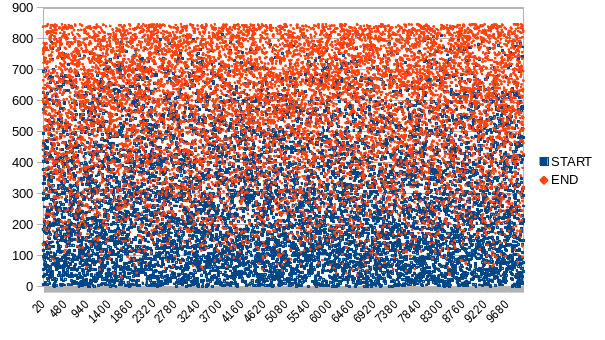
As you can see the sample size chunks are well randomized, so we cover pretty much all possibilities here.
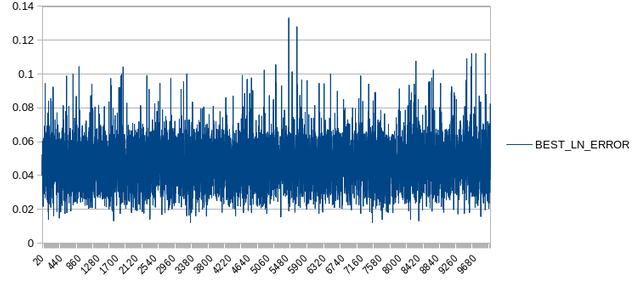
The LN difference between the forecast and the actual price is also random but with a relatively small variance, per data chunk:
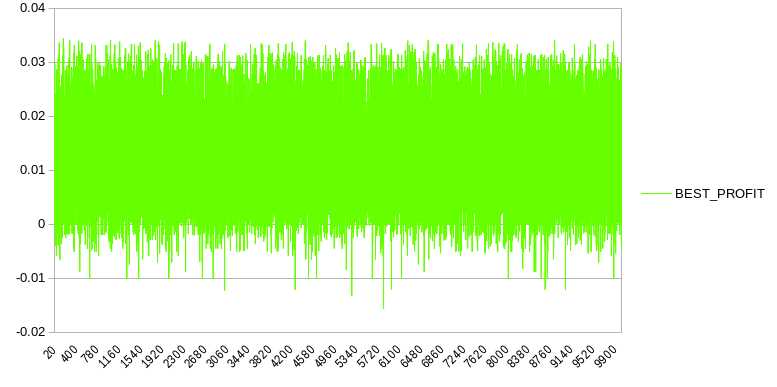
And the Profit which his the total profit at the end of the simulation per datachunk is also random, but notice, most of the values are above zero and the average is certainly above zero:
Now if we sort the Profit in descending order, we can see that the sample size is directly correlated with the Profit. This means that the more data we use, the higher the profit, literally. So due to the adaptive nature of the strategy, the bigger the input, the bigger the potential profit:

And also the LN Error is dependent on the data size, directly correlated, so the more data we use, the smaller the error and the higher the accuracy of our forecast. So our optimization is pretty robust and accurate:
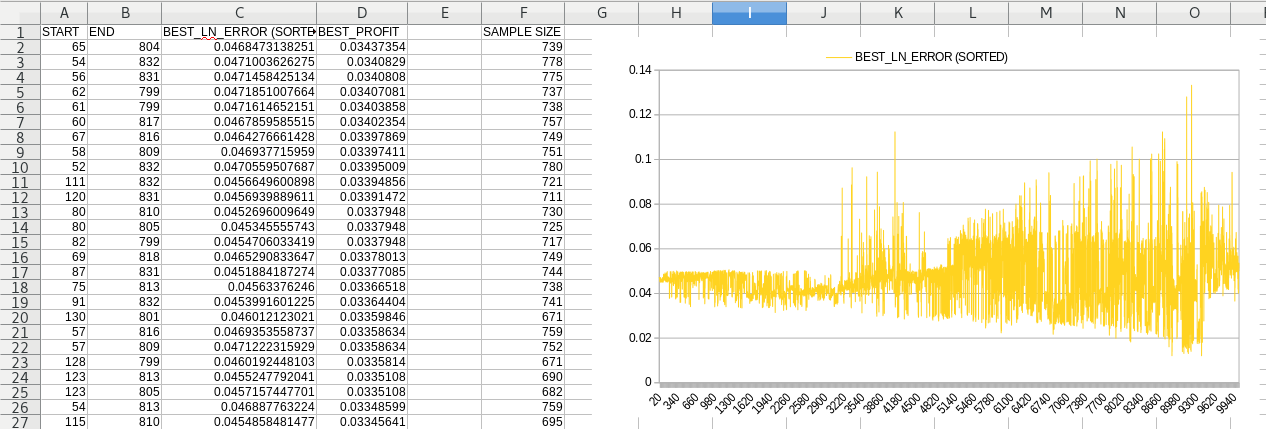
The average LN Error is 0.04664 with a STDEV of 0.011848.
The average Profit is 0.01228 wit ha STDEV of 0.010563.
This means that there is a 12.2433% probability that my strategy is not profitable (after 10,000 random tries).
So the current optimization (not complete yet) already suggests that my strategy is profitable, provably, with a probability of 87.7567%.
Conclusion
I haven’t even finished my research yet, yet my strategy is already provably profitable. It can be quantitatively proven that it’s a profitable trading strategy with a probability of 87.7567%.
Maybe if I’d add more data to it or tweak it a little bit more, perhaps a more rigorous optimization, and it could guarantee the profitability, although it’s very probable already.
I wont publish the strategy itself but you could e-mail me if you are interested in buying it.
Although I will start publishing cryptocurrency forecasts here, so that you can see yourself how accurate the system is.
If it’s profitable then it has to perform well on live data, and there is plenty of data, so I’ll start probably with Ethereum forecasts for now and see how well we will perform.
The forecasts will be for educational purposes only, if you decide to trade on the information it will be on your own risk. Although the strategy seems profitable, I can’t guarantee the profits and I don’t assume responsibility for potential losses either.
But it will be fun to see how accurate my forecasts will be. Stay tuned! 😄😄
Sources:
https://pixabay.com

Congratulations! This post has been randomly Resteemed! To join the ResteemSupport network and be entered into the lottery please upvote this post and see the following rules.