The Oil Market [3/3] - Forecasting Crude Oil Prices!

Last part of my Oil series, I forecast the Crude Oil price for the next year in this article, and let's see what the future holds. I have more than 35+ years of historical data on a daily timeframe (since the 80's excluding weekends), so every element on the X-axis will represent 1 day. We have 8448 elements, so that should give us a good statistical confidence.
I wanted to finish this series, I don't like to leave loose ends, so the series will be finished with an overall forecast. If you have missed the previous parts, you can read them here:
- [1/3] https://steemit.com/money/@profitgenerator/the-oil-market-1-3
- [2/3] https://steemit.com/money/@profitgenerator/the-oil-market-2-3
FORECASTING
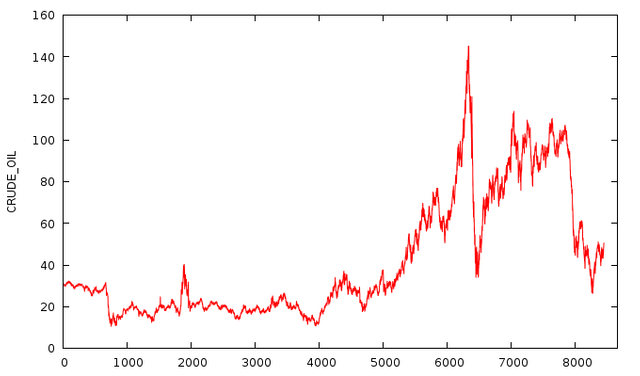
This is how the Crude Oil market looks like across all these years, it's denominated obviously in USD, and it has been very volatile these years. First thing to do is to find the right model on the historical data, and this takes a lot of computing power (about 30-45 minutes for me).
So after 45 minutes, the best model is found, just to save you the work, it's ARIMA(1,1,8) with constant with an error of 0.65614 , unfortunately I forgot to save the coefficients, so you have to calculate them yourself, but you already know the model, and the rest is easy. Then you can insert them into this formula:
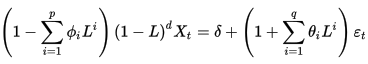
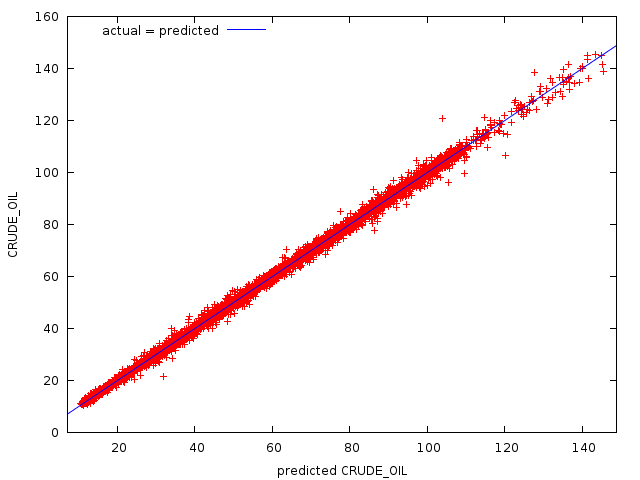
Where the (p,d,q) represent the order in our ARIMA(1,1,8), therefore p=d=1 and q=8and the rest should be calculated by yourself, if you want to forecast for yourself. Moving on, now that I know that (1,1,8) is the optimal order, I will forecast 20% of the data from the other 80% of the data, to test the forecasting accuracy.
Looks pretty accurate, with an error of only 20.237(the forecast error is always way bigger than the fitter error, obviously), and the boundaries represent pretty well, the price range. It should not be perfect, since it's a fixed boundary, if we want an accurate boundary, we should use GARCH models. But for ARIMA, we focus on the mean not the boundary, and the mean is accurate as well, it is right at the middle of the price, it's as good as it can get, now let's forecast into the future.
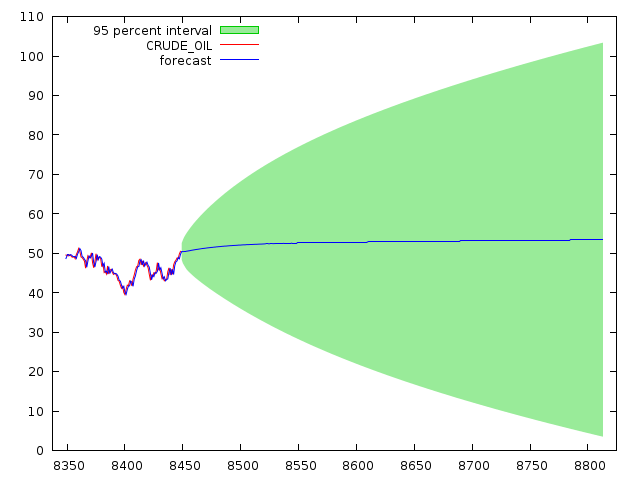
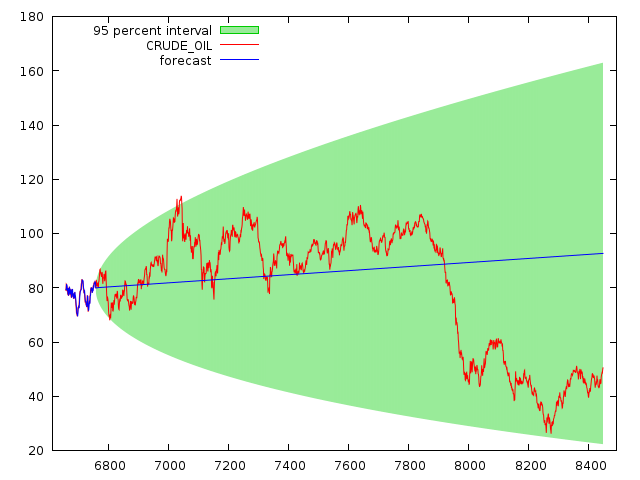
This is how the future will probably look like. It seems that the price should be bound between 0$-105$, while the price in 365 days from now should be on average 53.46$ with a STD error of 25.481$ and a 95% confidence interval between 3.52$ - 103.40$.
NOTE:
One thing I forgot to mention in my previous forecast articles, although I think it's obvious, is that the ARIMA model doesn't predict the price itself, it actually predicts the mean of the future probability distribution of the price. We know the price data is heteroscedastic, non-stationary, therefore the Mean is "moving", all ARIMA does is estimate the future Mean. There is no technology on Earth that can predict the price point-by-point, otherwise we would all be Trillionaires, the best we can do is predict a tendency of the future price where it might hover around.
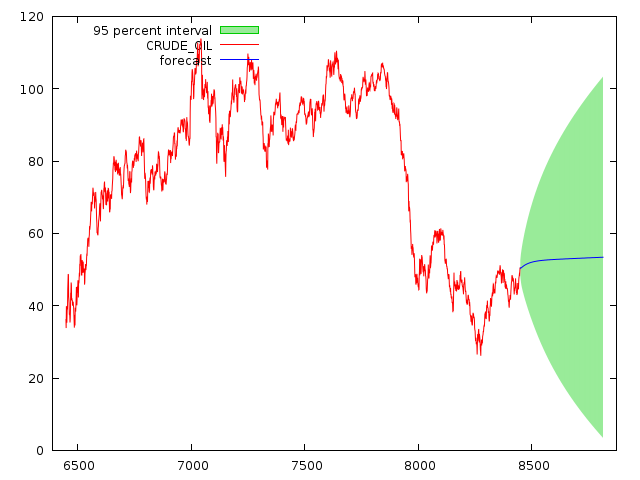
Here is another chart from a better perspective. Analyze it and think about it, it looks like the the high 120$ levels are unlikely to be broken, so we should expect a relatively cheap oil in my opinion.
Disclaimer: The information provided on this page might be incorrect. I am not responsible if you lose money using the information on this page! This is not an investment advice, just my opinion and analysis for educational purposes.
Credits: Formula from Wikipedia.org
This post has been linked to from another place on Steem.
Learn more about linkback bot v0.4. Upvote if you want the bot to continue posting linkbacks for your posts. Flag if otherwise.
Built by @ontofractal
Included in Steemprentice Spotlight

And tweeted by SteemLand :)
Thanks a lot!
Strange, no comments so far, does anyone have any questions?