How to trade the markets #2 | Candlesticks and patterns
How do you get an edge to profit from the markets? The answer is that there are a multitude of ways to make money from trading. Some focus on understanding the fundamentals while others focus on technical analysis to get an edge. My preferred technique is price action trading.
In this series, I will go through the basics of price action analysis. I use no indicators, so no flashy chart setups. I prefer to keep my chart as clean as possible, just candlesticks and a few drawn lines. And these techniques can be used on any timeframe, but the higher the timeframe the more reliable they will be.

Candlestick Basics
When we represent price on a chart to better read the market there are several style options, the most common ones are line chart, bar chart, and the most popular one: candlestick chart.

Candlestick charts originated in Japan, but is today the most used chart to read price.
Each candle represent the price movement in a defined time frame. The time frame can be whatever you want, but normally it will be between 5 minutes and 24 hours. The chart will be called by the time frame chosen, so for example 5 minute chart, 4 hour chart or daily chart.
The candle is defined by 4 prices: the open price, the highest price, the lowest price and the close price. And they all refer to what happened within the defined time frame.
Here is the anatomy of the candlestick:

Market context
- When you want to know how a market is doing and what the sentiment is, focus on the current candle and the last few candles only. A common mistake is to try to take in the whole picture of the graph, instead just focus on the last few candles. Ask yourself “what is the current sentiment in the market?” by reading the current candlesticks.
- Look at where the current price action is happening, is it near former support and resistance levels? In the first part of this series I covered these levels, and the conclusion was that we want to trade when the price is at or near support and resistance. So look for candlestick formations near these levels.
Candlestick formations
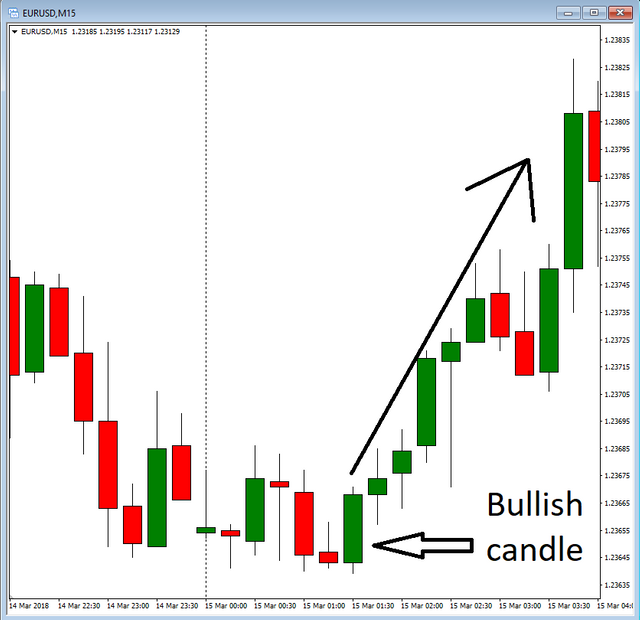
The bullish candle
When the price opens near the bottom of the candle and closes near the top (small wicks) we get a bullish candle. This is an indication that the price might continue up, a long signal.
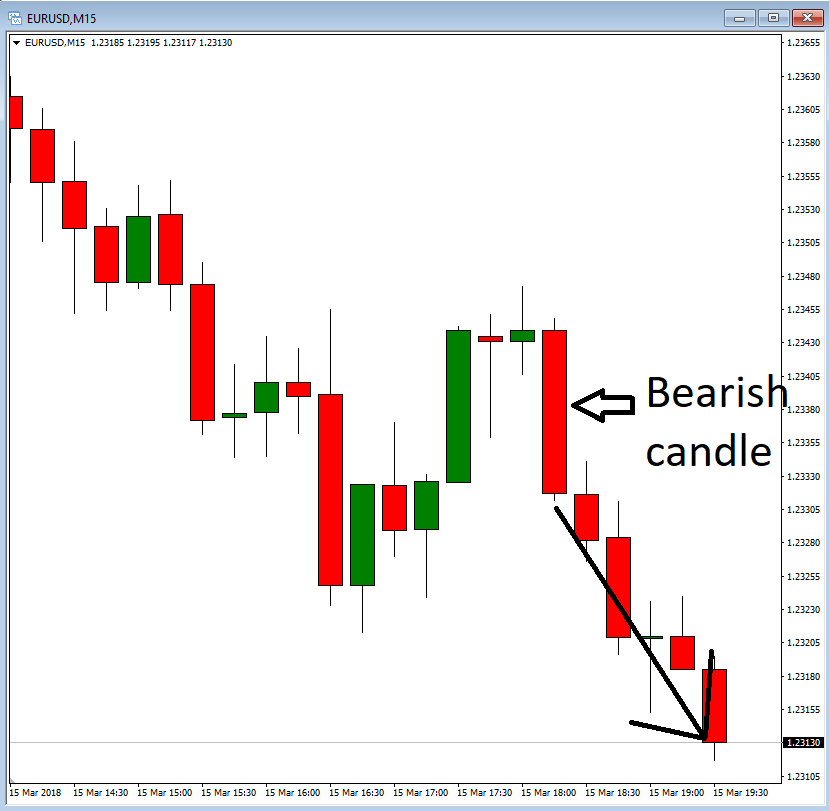
The bearish candle
When the price opens near the top of the candle and closes near the bottom (small wicks) we get a bearish candle. This is an indication that the price might continue down, a short signal.
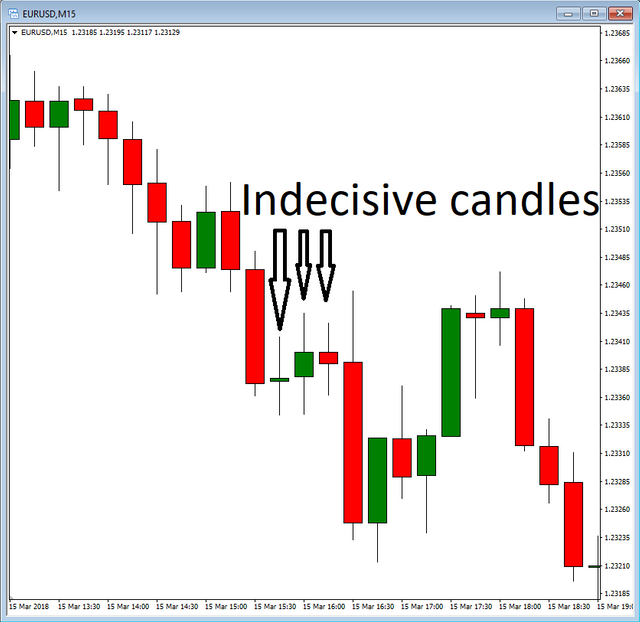
Indecisive candle
When the open and the close are closer together and we get longer wicks and an indecisive candle forms. If the open and close is equal we call it a doji candle. This is a signal of indecision in the market, a pause candle before the market finds direction again.
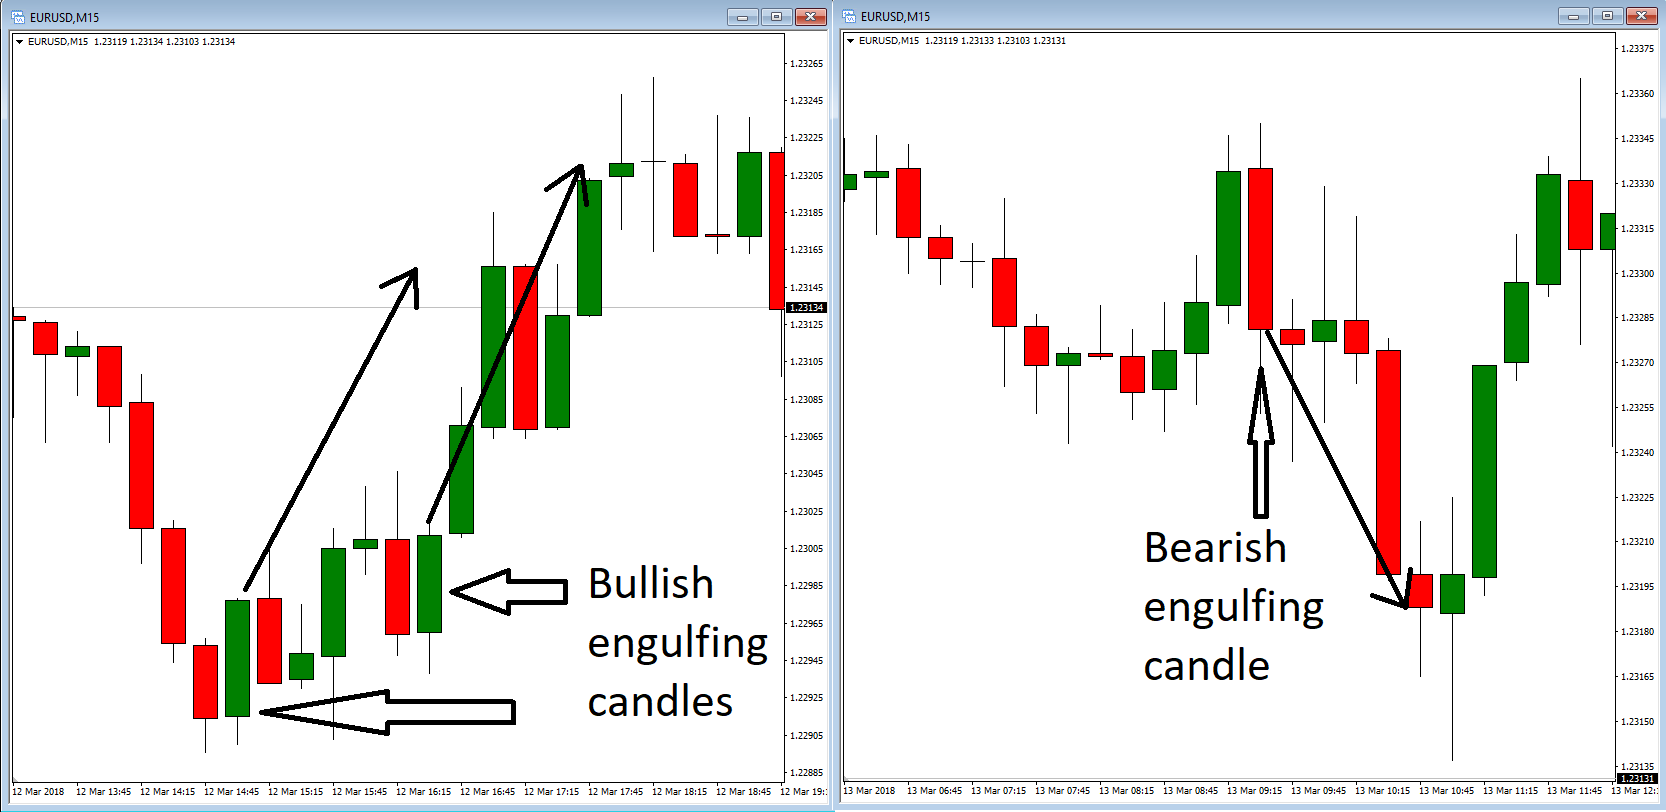
The engulfing candle
If a candle’s body covers the whole of the previous candle and it closes as a bullish or bearish candle (so small or no wick) then we call it an engulfing candle. It can either be bullish or bearish. These candle formations are strong buy (bullish) or sell (bearish) signals.
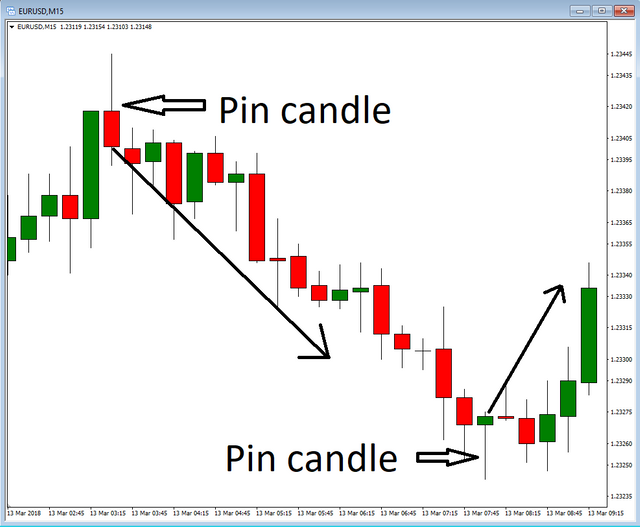
The pin candle
If price both opens and closes at one end of the candle and you get a long wick we have a pin candle. This candle shows that the price could not continue, and it was rejected. It is considered a sign of reversal and we anticipate that the price will move in the opposite direction of the current trend.
The inside candle
When all of the price action of a candle happens within the body of the previous candle we get an inside candle. This is an indecisive candle, but the anticipation of an inside candle is that when price breaks either the high or low of the candle it can move a considerable bit. So we wait for a breakout.
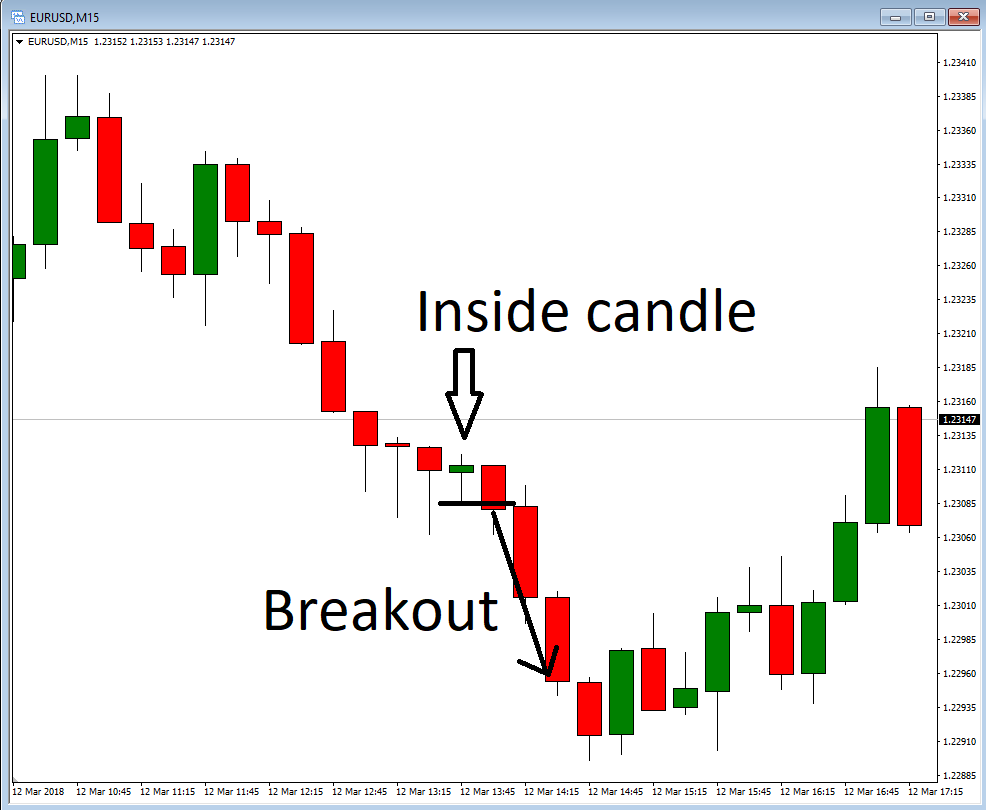


Chart patterns
The price action of candlesticks often forms larger patterns and traders use these to predict future price action. The most common patterns are:
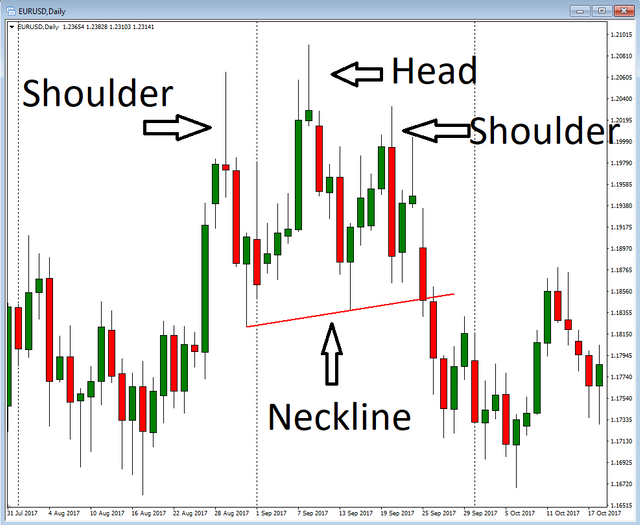
Head and shoulders
When the market forms three tops and the first and the last ones are at the same level, but the middle top is higher than the other two, then we have a head and shoulders pattern. This is a reversal pattern, and entry is normally taken when the neckline (see picture below) is broken.
An inverse head and shoulders happens similarly, but with three bottoms.
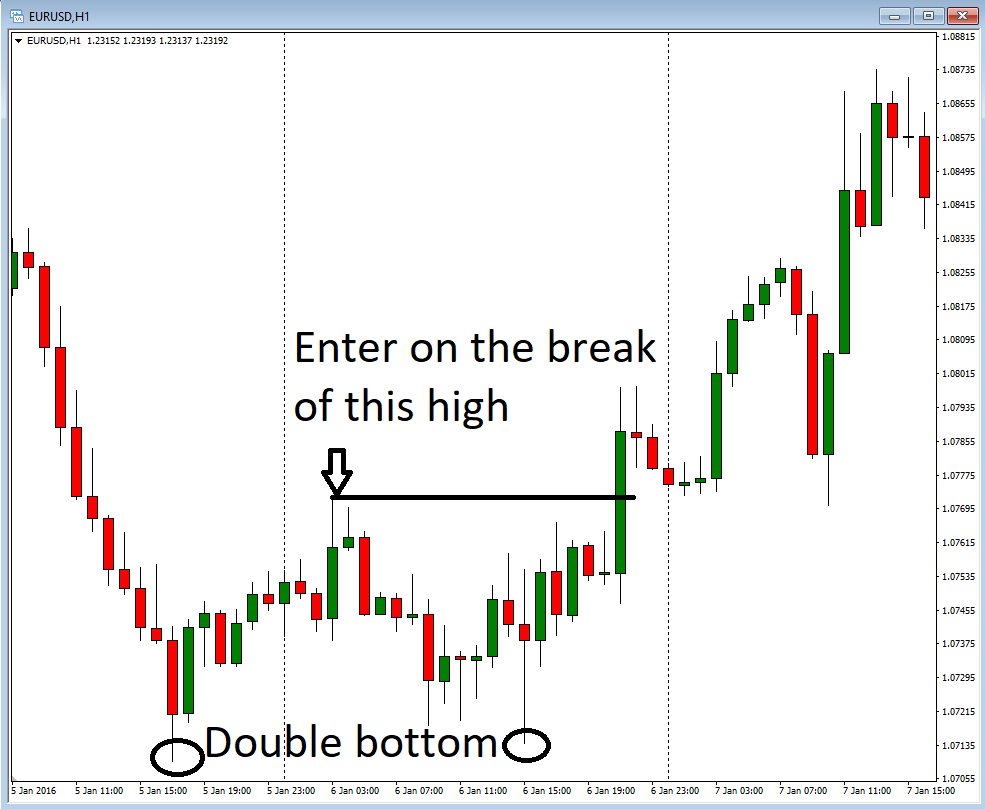
Double top and bottoms
When to tops or two bottoms at about the same price level form, we have a double top or a double bottom pattern. These are reversal patterns and the entry can be taken early when a reversal candle forms a top, or when the bottom between the tops is broken.
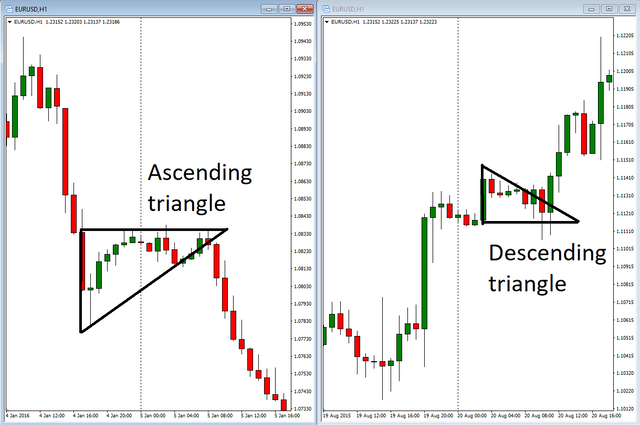
Triangles
This is a pattern that happens quite often and it comes in different shapes and inclinations.
Ascending and descending triangles: These are normally considered continuation patterns and entry is done when the price breaks out of the triangle.
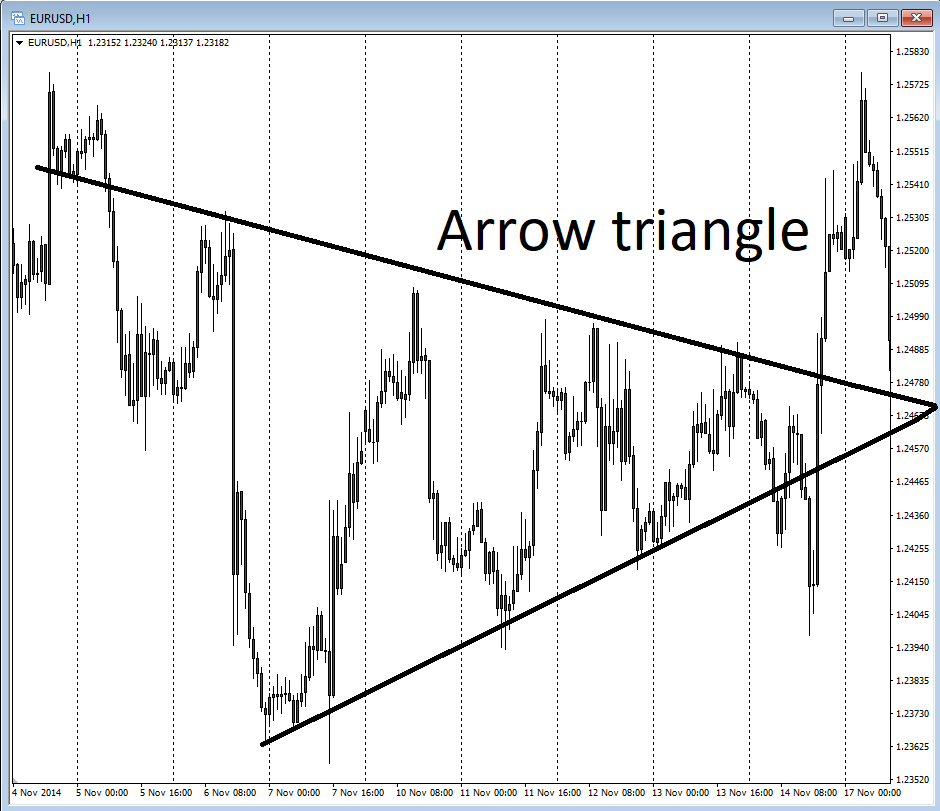
Symmetric triangle: Often price will form an arrow-shaped triangle and this is a neutral pattern as far as expectation of breakout direction. So either direction can be traded.
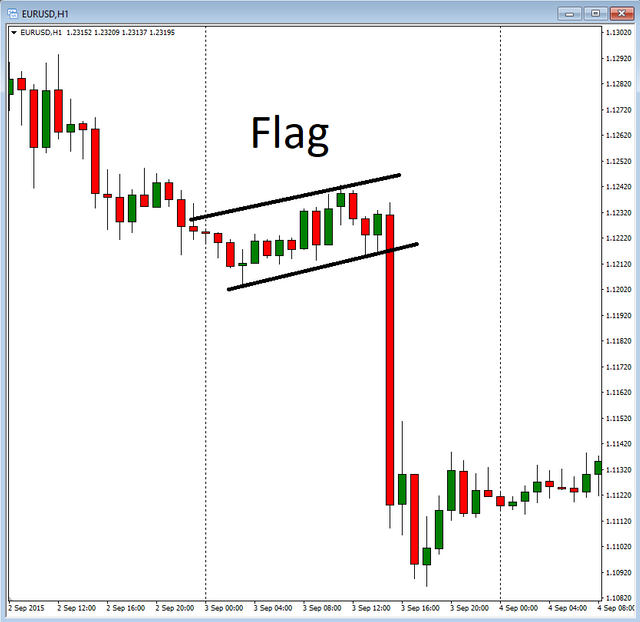
Flags
Small equidistant channels that work as pullbacks from the trend are called flags. They are continuation patterns and entry is normally taken when the channel is broken in the direction of the trend.


These are the most common patterns, but there are several others as well. Read the books by Steve Nison for a more comprehensive guide to candlesticks and patterns.
I hope you enjoyed this tutorial on support and resistance.
Please follow my blog for the rest of the series. I will cover the basic concepts of price action trading and how you can use them to make profit. 😁 👍
Part 1 support and resistance
This is not financial advice, everybody is responsible for their own trading. I am just sharing my own experience with the markets.
Congratulations @mariuse! You received a personal award!
You can view your badges on your Steem Board and compare to others on the Steem Ranking
Do not miss the last post from @steemitboard:
Vote for @Steemitboard as a witness to get one more award and increased upvotes!
Congratulations! This post has been upvoted from the communal account, @minnowsupport, by mariuse from the Minnow Support Project. It's a witness project run by aggroed, ausbitbank, teamsteem, theprophet0, someguy123, neoxian, followbtcnews, and netuoso. The goal is to help Steemit grow by supporting Minnows. Please find us at the Peace, Abundance, and Liberty Network (PALnet) Discord Channel. It's a completely public and open space to all members of the Steemit community who voluntarily choose to be there.
If you would like to delegate to the Minnow Support Project you can do so by clicking on the following links: 50SP, 100SP, 250SP, 500SP, 1000SP, 5000SP.
Be sure to leave at least 50SP undelegated on your account.
Congratulations @mariuse! You received a personal award!
Click here to view your Board
Thank you for the decent guide https://9blz.com/bearish-engulfing-candlestick-pattern/