How to trade the markets #1 | Support and Resistance
How do you get an edge to profit from the markets? The answer is that there is a multitude of ways to make money from trading. Some focus on understanding the fundamentals while others focus on technical analysis to get an edge. My preferred technique is price action trading.
In this series, I will go through the basics of price action analysis. I use no indicators, so there will be no flashy chart setups. I prefer to keep my chart as clean as possible, just candlesticks and a few drawn lines. And these techniques can be used on any timeframe, but the higher the timeframe the more reliable they will be.
Support and resistance
First up is support and resistance which really is the basics of price action trading; it is the framework from which I trade. Support and resistance are price levels that price has reacted to and turned at earlier.
- Support
Support levels are levels that are lower than the current price and that earlier have held price from breaking through, and they can be perceived as floors that might support price so it does not pass through. - Resistance
Resistance levels are levels that are higher than the current price and that earlier have held price from breaking through, and they can be perceived as ceilings that might resist price so it does not pass through.
If price should break through these levels then the former support level can become a new resistance level and vice versa.
Why use support and resistance?
So why are support and resistance levels so powerful in trading?
- Volatility and price movement
These are levels that many traders watch and want to enter or exit their trades close to. Consequently, we get more volatility and price tends to move with higher speed and with higher volume. It can be easier to predict future price movement around these levels. - ROI
If you find an opportunity near a support or resistance level you can hide your stop-loss on the other side of the level. A tight stop-loss combined with increased volume increases the potential ROI on these trades since your risk (stop-loss) is low and your potential reward is higher. This is the key to successful trading, minimizing the losses and optimizing the winners.
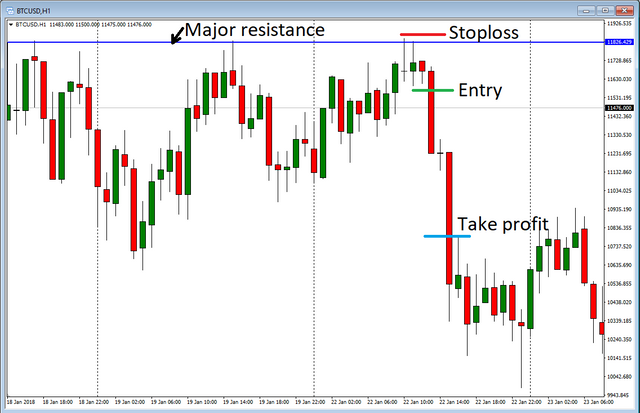
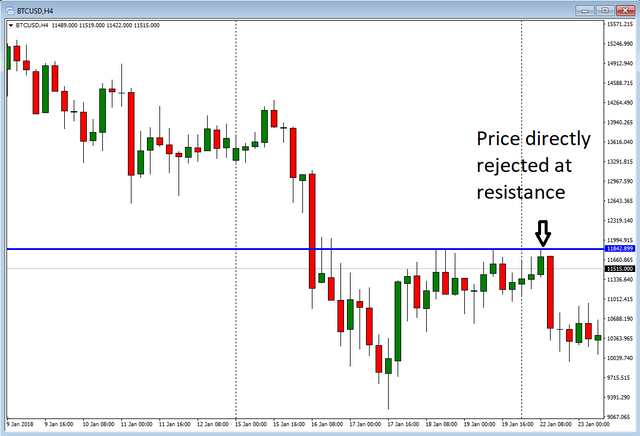
Here is an example of how a resistance level can be used to hide a tight stop-loss behind:
How to set support and resistance levels
When setting your support and resistance levels there are a few things to consider.
- To get a clearer picture and a birdseye view of the market zoom out or, even better, use a higher time frame.
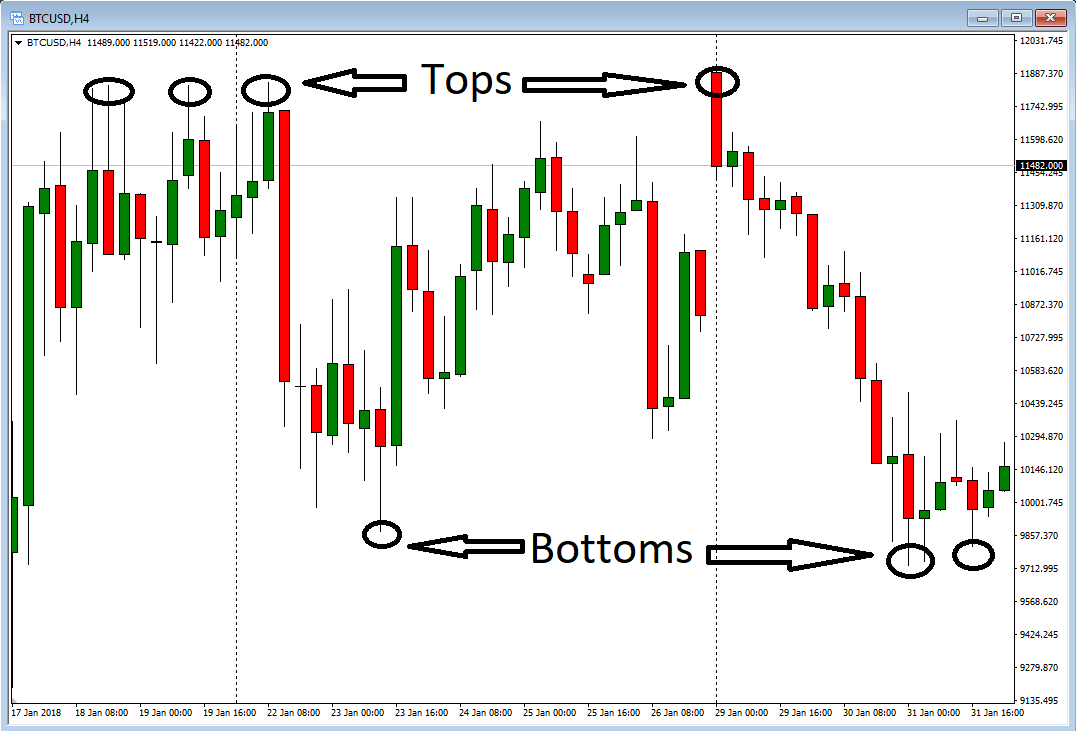
- Find earlier tops and bottoms on the chart. Look for the major ones, the more price was rejected the better. The recent tops and bottoms are more significant than the older ones. Example from BTCUSD:
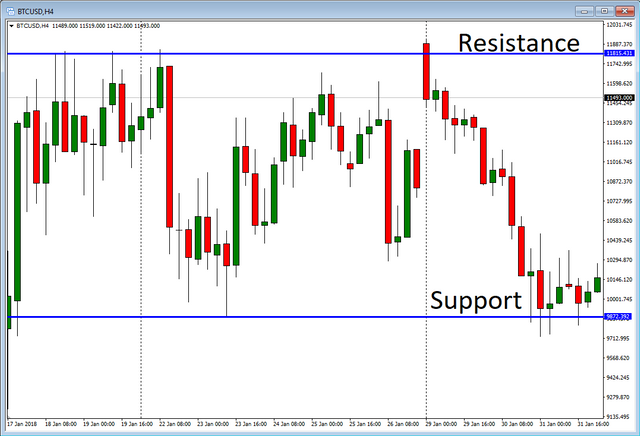
- Then find levels where more than one top or bottom were formed, and draw lines at those levels, like this:
- Even though the price has broken through earlier the level can still be significant.
- A level can consist of both tops and bottoms, it is for instance not like a support level only consist of bottoms. We are looking for levels that have rejected price earlier whether it formed a high or a low.
- Pay attention to levels that form near round numbers, e.g. 1.2500 on EURUSD or 12,000 on BTCUSD. These levels become extra strong because of the psychological effect these round numbers have on traders. And when they are broken the market tends to accelerate for the same reasons.
- Often these levels are close to each other and form zones of support and resistance. Here is an example from BTCUSD:
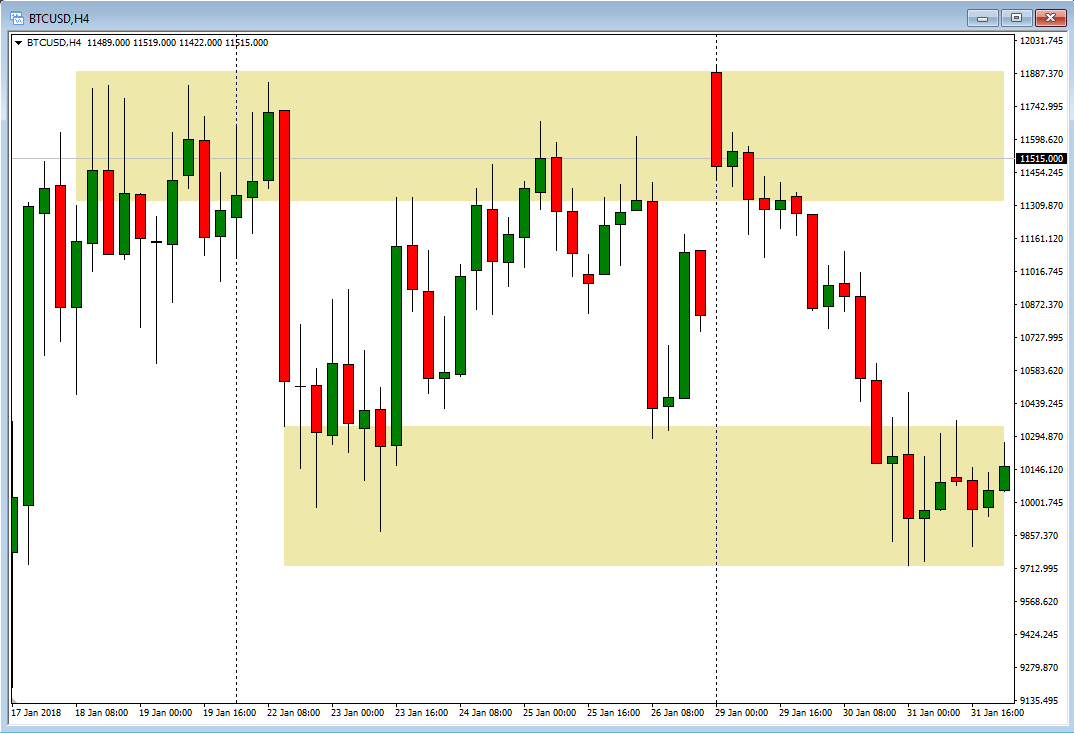
- Lastly I want to add that this is not an exact science. You will never be able to set levels that are exact and where price is sure to bounce. Do your best to find major levels from higher time frames and draw zones at which the price has reacted earlier.
3 ways to trade support and resistance
So you have set your support and resistance levels and found the time frame you want to trade from. Now what?
Here are the 3 most common ways to trade around these levels.
Rejection
This is what most traders look for when price approaches a major level: that price is rejected and continues in the opposite direction. Look for reversal signs in the form of price stalling and formations of reversal candles, reversal patterns, trendline breaks, etc (I will cover this in the next parts of this series).
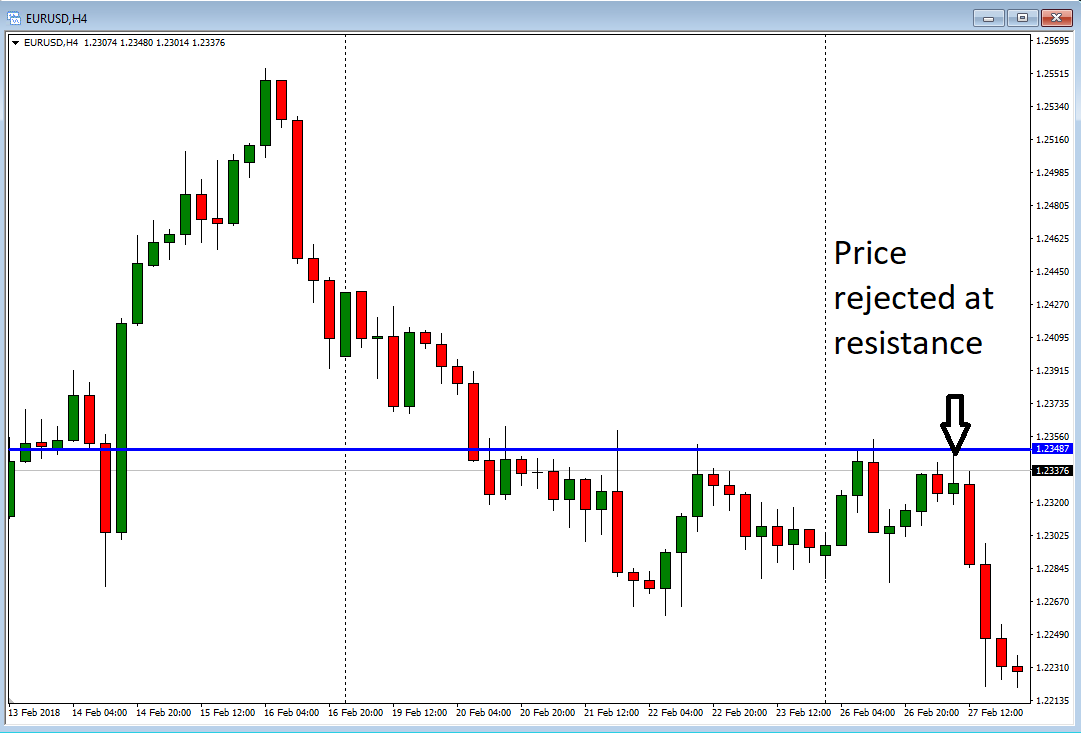
Examples of direct rejections from resistance levels:
Breakthrough
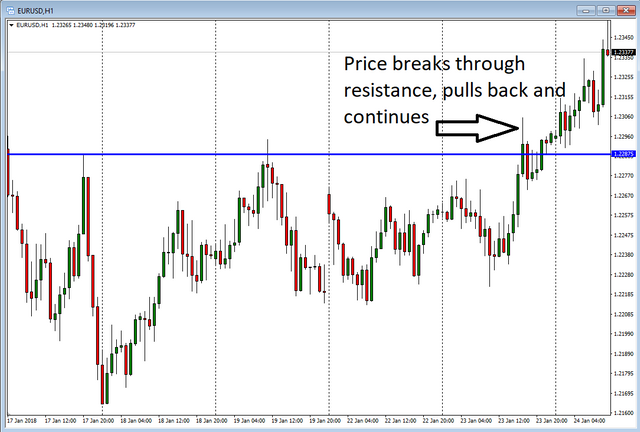
If the market has enough momentum it might just pass through and establish itself on the opposite side of the level. I am typically looking for price to pass through a level and then having several candles close on the opposite side to confirm that the level is broken. If price breaks through, two candles close on the opposite side, but then price returns to the other side of the level then the price has not broken through. Price needs to establish itself and the market must accept the new price level.
The best scenario is a breakthrough, then a pullback to the level before a continuation:
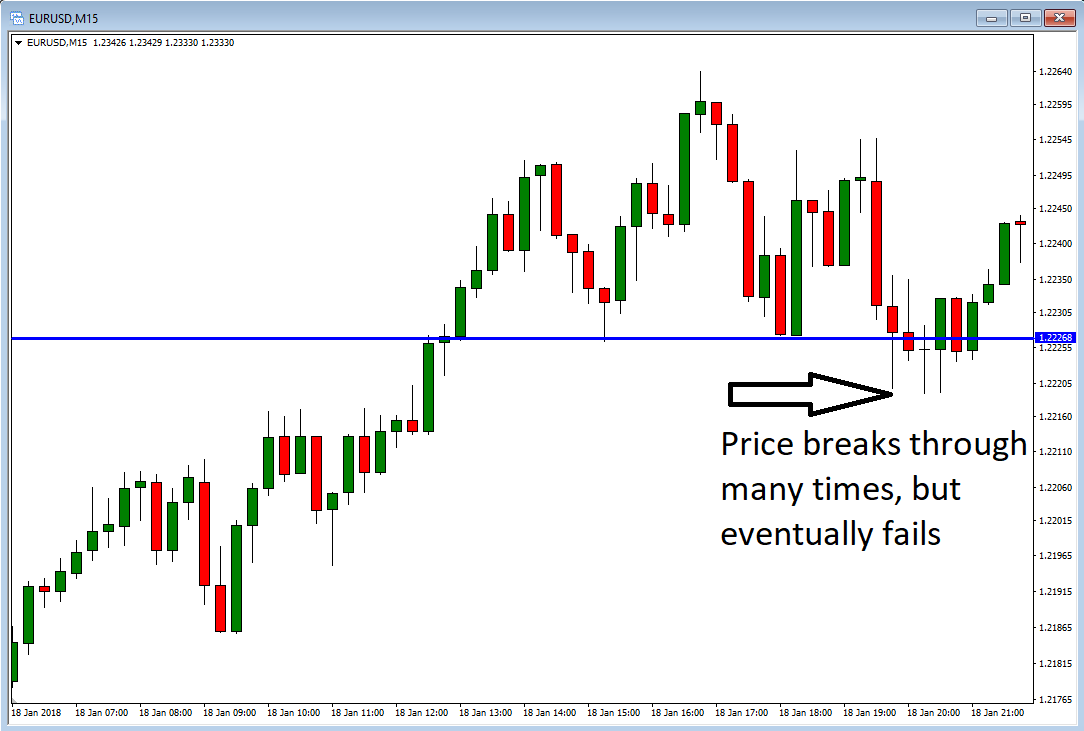
Breakout failure
This is probably my favorite out of the 3. It happens if the price passes the level, but cannot sustain itself there and goes back to the other side of the level, price failed to establish itself to get a breakthrough. When this happens the market often goes strongly in the opposite direction since a lot of traders got caught on the wrong side of the market and need to exit their positions.
Here price breaks through several times, but cannot sustain itself below support.
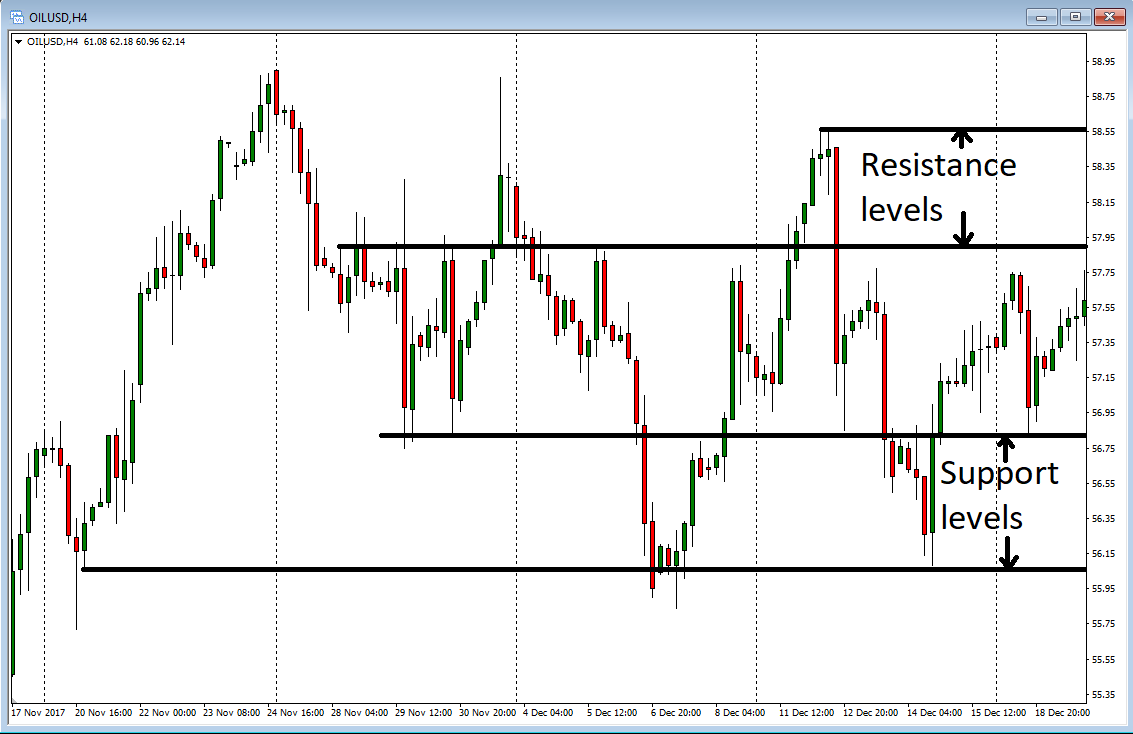
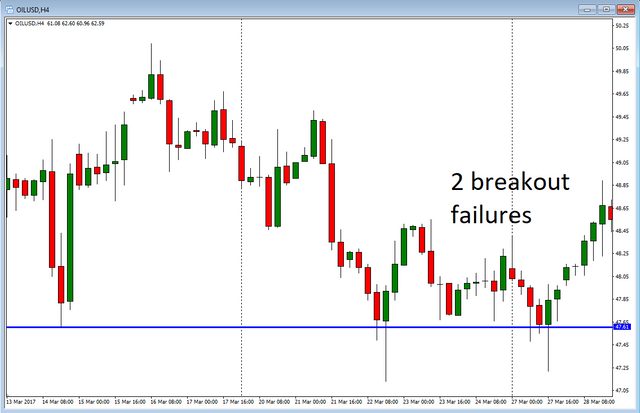
Another example, this time from OILUSD, where price breaks through a major support level two times, but each time it fails and bounces off the level:
I hope you enjoyed this tutorial on support and resistance.
Please follow my blog for the rest of the series. I will cover the basic concepts of price action trading and how you can use them to make a profit. 😁 👍
This is not financial advice, everybody is responsible for their own trading. I am just sharing my own experince with the markets.
Thanks for a clear guide!
Thanks! Glad you liked it.
Nice Post !
Thansk of Sharing information
Thank you!
very nice to say
Thank you!
Congratulations! This post has been upvoted from the communal account, @minnowsupport, by mariuse from the Minnow Support Project. It's a witness project run by aggroed, ausbitbank, teamsteem, theprophet0, someguy123, neoxian, followbtcnews, and netuoso. The goal is to help Steemit grow by supporting Minnows. Please find us at the Peace, Abundance, and Liberty Network (PALnet) Discord Channel. It's a completely public and open space to all members of the Steemit community who voluntarily choose to be there.
If you would like to delegate to the Minnow Support Project you can do so by clicking on the following links: 50SP, 100SP, 250SP, 500SP, 1000SP, 5000SP.
Be sure to leave at least 50SP undelegated on your account.
Very useful information. But how do you protect yourself against false breaouts ?
Thanks!
To avoid false breakouts, don't enter at the breakout, but wait for a pullback and then signs of continuation. So I would wait for a pullback and either enter after a bullish candle (for uptrend) or wait for the breakout high to be broken.