Crypto Market Update - 10 April 2018
Hi guys!
Here are my price update for today!
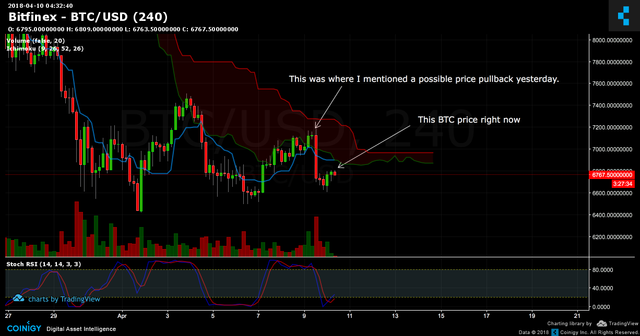
Bitcoin - 4 Hour Chart
Tools used: Ichimoku Cloud and Stoch RSI

I mentioned a possible price pullback yesterday (using daily time frame as bigger time tells more story).
This is what I wrote yesterday.
Volume decrease, stoch RSI indicates BTC is almost overbought which could reverse the direction. Basically there is a possibility of a pullback.
By looking at that 4 hour chart if BTC have a nice and steady volume for the next few days, I think it's high possible that BTC will breakout from the cloud. But looking at previous data BTC has never been able to maintain its price above the cloud so the same pattern could repeat itself here.
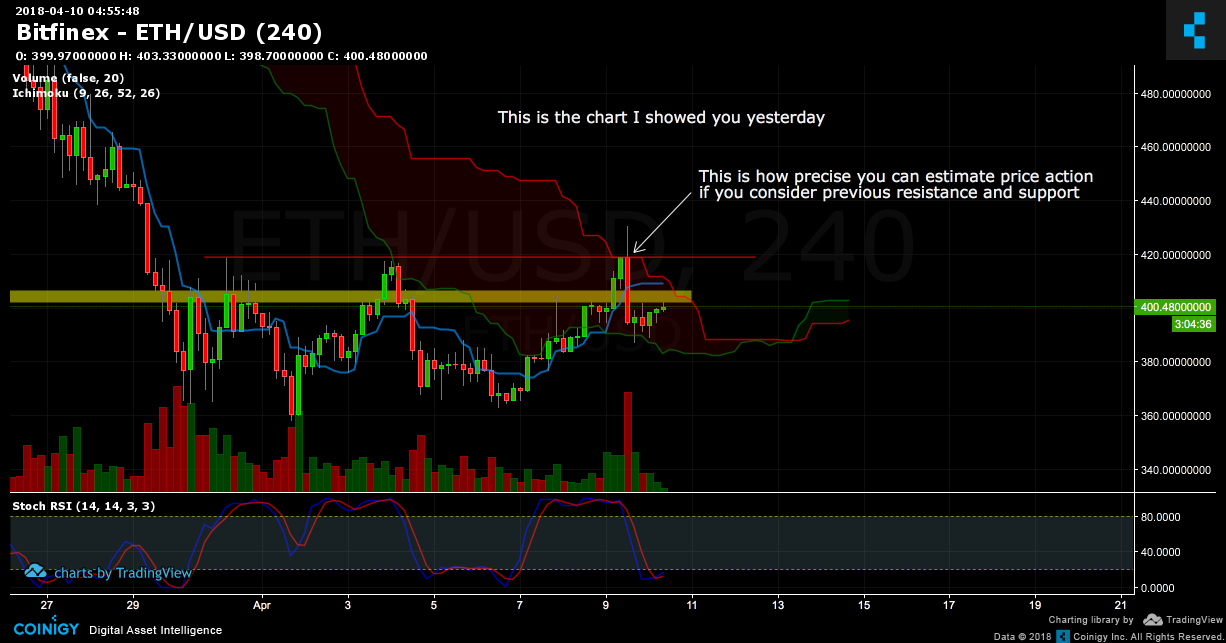
ETH - 4 Hour Chart
Tools used: Ichimoku Cloud and Stoch RSI

I mentioned yesterday also about ETH might fail breaking this resistance level. All I did was looked at support and resistance level and with help of a few more indicators.
Since stoch RSI is overbought on ETH here I think it's highly likely that ETH will fail breaking this $420 resistance.
Looking at the volume there I think ETH will stay oversold for a while. Check the previous time ETH was oversold on stoch RSI. Although it looks like ETH is about to breakout from this cloud, I think the volume tells otherwise.
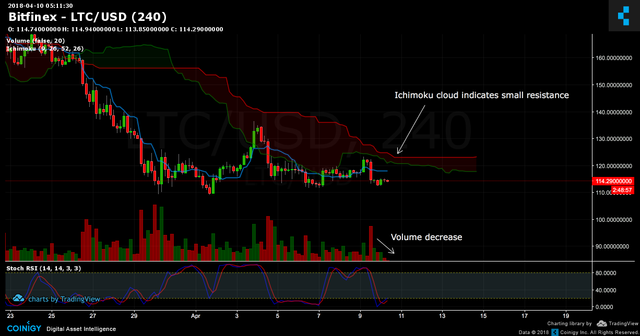
LTC - 4 Hour Chart
Tools used: Ichimoku Cloud and Stoch RSI

With enough volume surely LTC could breakout from this cloud since it is on the oversold zone (indicated by Stoch RSI). If not supported by volume LTC is likely to consolidate around this price which is key level support (previous support and 200 SMMA support).
I think overall the this key level support will hold LTC price at the very least since so far 200 SMMA support hasn't been broken.
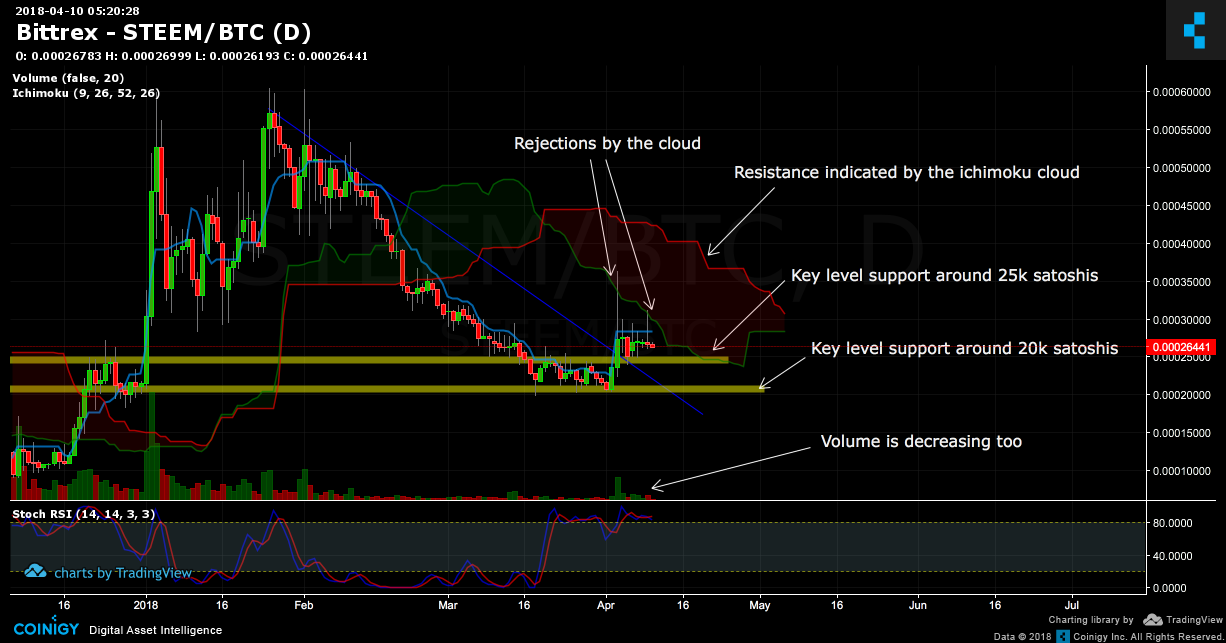
Steem - Daily Chart
Tools used: Ichimoku Cloud, Stoch RSI and Trendlines

You will see several confirmations of a pullback from this daily chart:
- Volume is decreasing
- Stoch RSI is oversold
- Ichimoku cloud indicates there is a lot of resistance around 25K satoshis
- Several rejections by the ichimoku cloud on daily chart
I think if Steem have another pullback it will be at least to the 20K satoshis price level since this is previous support before the breakout from the descending triangle.
Notice that if this scenario plays out. My prediction on possible pattern on the previous wave repeats itself is slowing happening.
Disclaimer
You know the drill guys. This is just opinion and not a financial advice. Do your own research and decide your own trades. Cheers!
Coins mentioned in post:
We recommended this post here.