Crypto Market Update - 8 April 2018
I am still uploading my videos into youtube (dTube is not working for some reason) as for this moment so I will update with a link later on this post.
Here are todays' summary of crypto market:
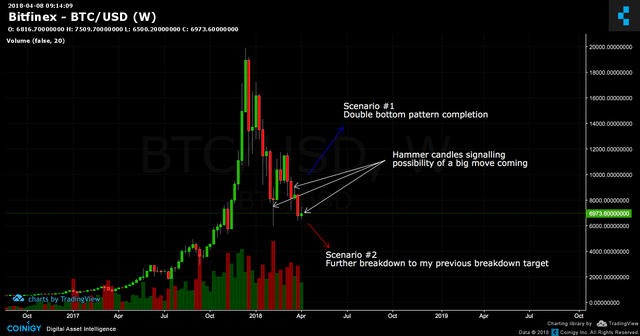
BTC - Weekly Chart

If BTC close around this key level support by the end of the week, the latest weekly candle will form into a hammer candle. Which usually signals a big move is just around the corner.
I've mentioned 2 possible scenarios there as for targets I will give an update tomorrow to see if there is any sign of either of those possible scenarios.
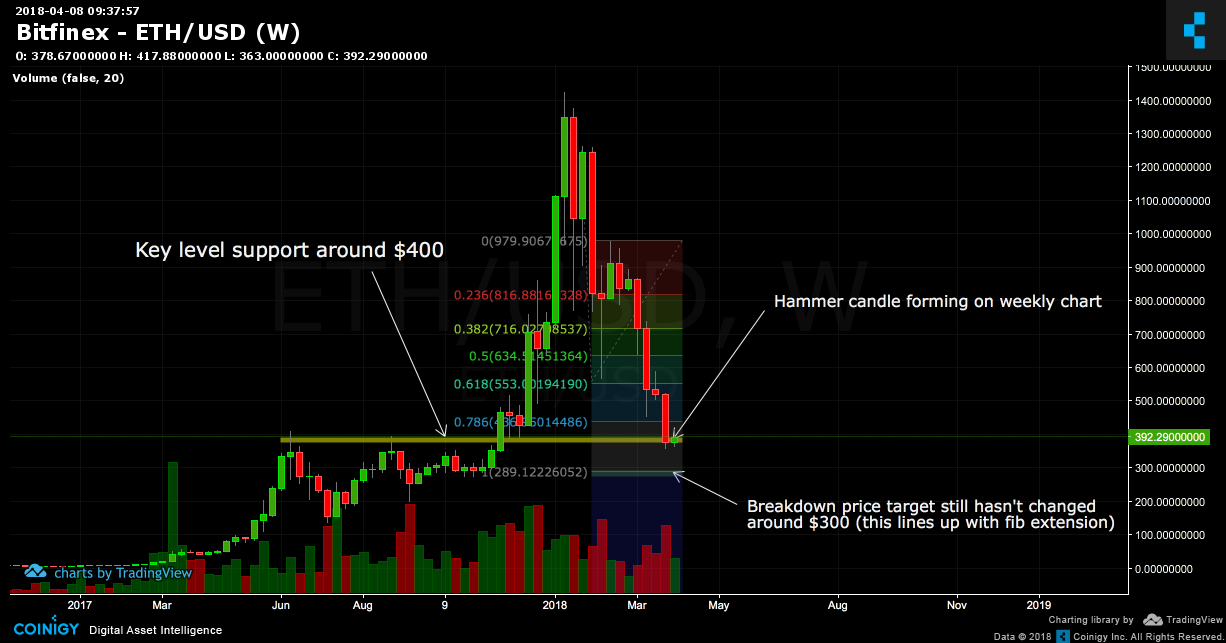
ETH - Weekly Chart
Tools used: Fib Extension and Trendlines

Similar to BTC a hammer is forming on the weekly time frame but on ETH's case I think will turn into another pullback to around $300. As I've mentioned several times on my previous posts.
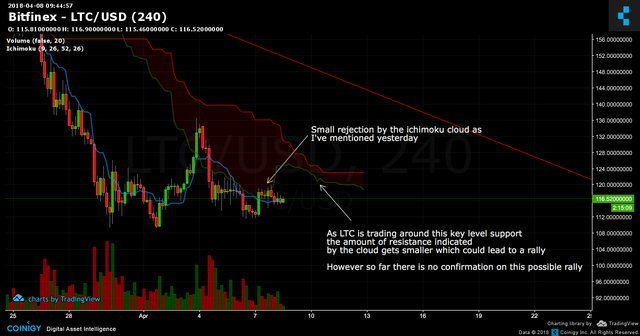
LTC - 4 Hour Chart
Tools used: Ichimoku Cloud and Trendlines

As for LTC the weekly chart is more less similar to BTC and ETH. Hammer candle is forming which could be a signal for a big move.
However on the 4 hour time frame as you can see there the ichimoku cloud indicates that there is less resistance around this price area in the next days ahead which could lead to a possible rally to the upside. Although there is no confirmation on this possible rally yet so far.
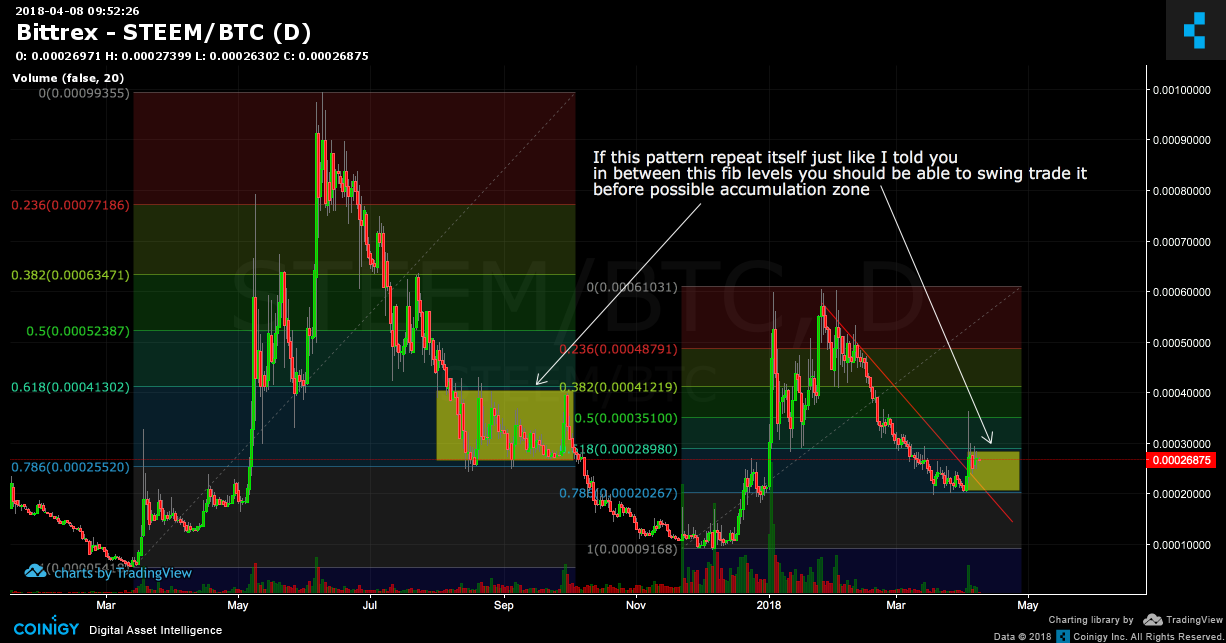
Steem - Daily Chart
Tools used: Fib Retracement and Trendlines

This is a possible scenario happening on Steem/BTC pairing as Steem might be completing a cycle before startoing a new one. In between these fib level there are a possibility of 40-60% price spike before going into an accumulation zone.
Disclaimer
You know the drill guys. This is just opinion and not a financial advice. Do your own research and decide your own trades. Cheers!