Steem Total Value Powered Up - $38 million - October 9, 2022
This is next in my series of posts reviewing the amount and value of powered up STEEM on the Steem blockchain. For previous posts, see the end of this entry.
Noteworthy in the last week |
|---|
- Week over week, the number of powered up STEEM increased by about 158K SP, or 1/10%.
- Over the course of the week, we saw six daily increases and five new highs in the number of staked STEEM.
- The modeled value gained ground against all comparison values. Changes ranged from 2.57% against SBDs to 5.94% against USD.
- In terms of all comparison values except for TRX and USD, the modeled value remains above its January 1 baseline.
- In terms of all comparison tokens except TRX and USD, the modeled value is above its long term mean.
- This week (Sunday through Saturday) saw a total of 458K STEEM powered down, which is a decline of about 3 1/2% as compared to last week's 475K STEEM.
Here are the numbers as-of a few minutes ago |
|---|
Total value locked in powered-up STEEM (USD): $37,793,110.05
STEEM market cap $91,074,679.66
Locked value in terms of other tokens:
| token | price | locked value equivalent | Jan 1, 2022 | pct of Jan 1 baseline |
|---|---|---|---|---|
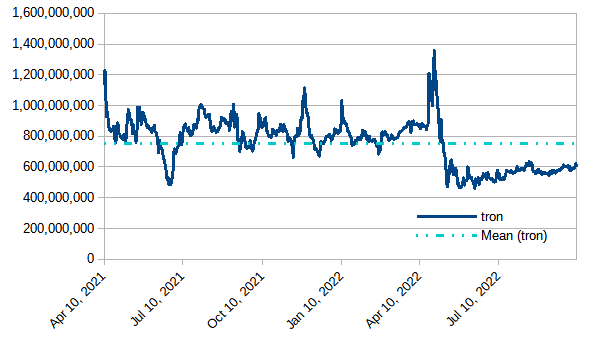
| tron | $0.06 | 605,532,662 | 809,173,538 | 74.83% |
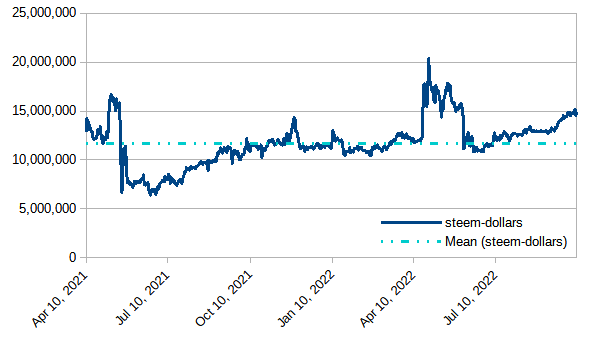
| steem-dollars | $2.51 | 15,057,015 | 11,284,131 | 133.43% |
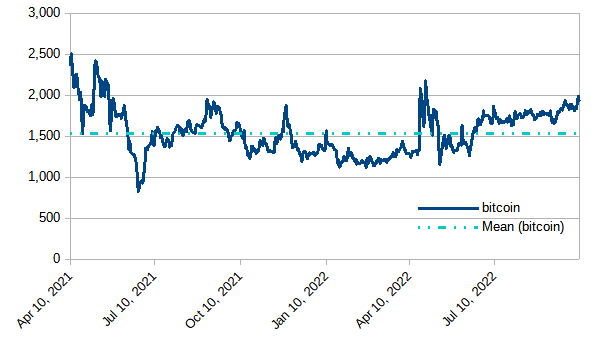
| bitcoin | $19,412.91 | 1,946 | 1,300 | 149.73% |
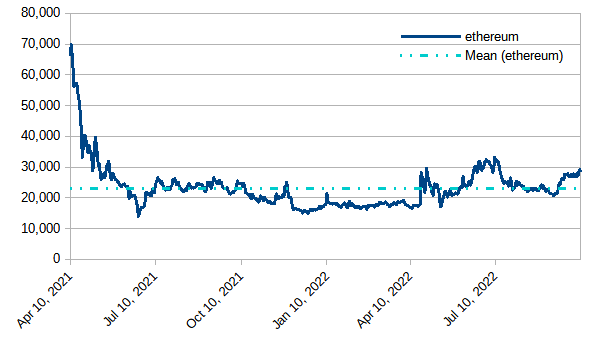
| ethereum | $1,318.42 | 28,665 | 16,501 | 173.72% |
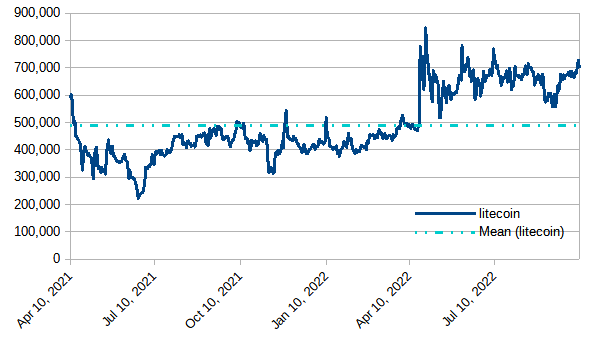
| litecoin | $53.58 | 705,358 | 411,561 | 171.39% |
| steem | $0.23 | 164,295,011 | 142,930,214 | 114.95% |
| USD | $1.00 | 37,793,110 | 61,837,042 | 61.12% |
|
|---|
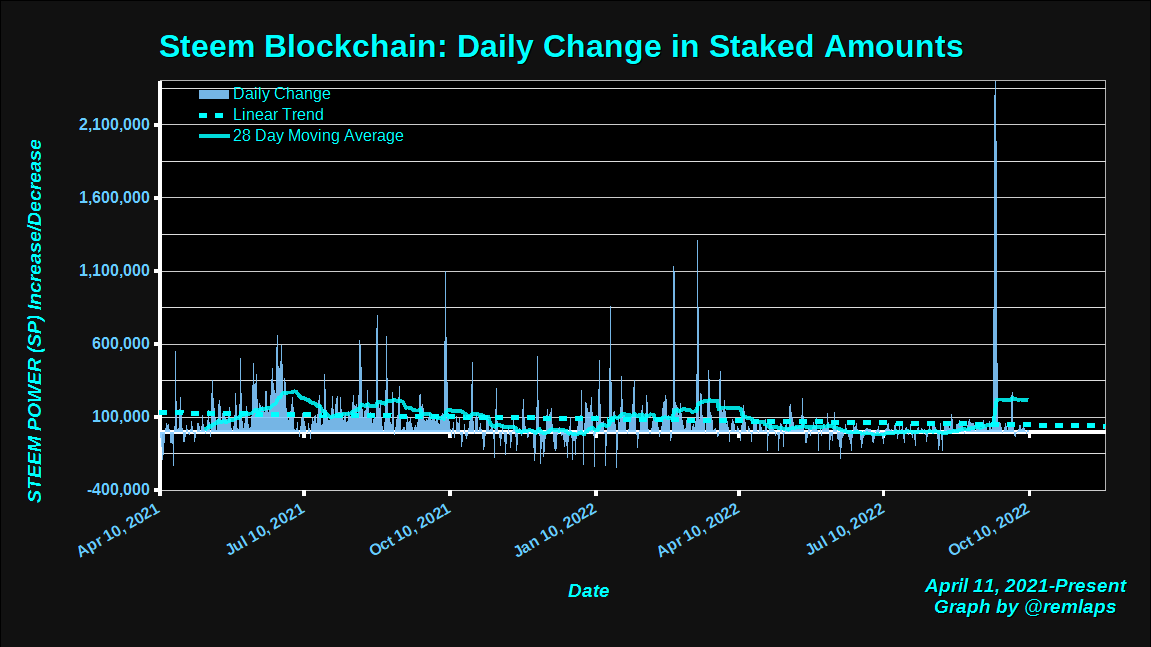
Daily Changes
Here is a chart of daily changes in powered-up STEEM from April 11, 2021 to present. The graph also includes a linear trend line and a 28 day moving average.
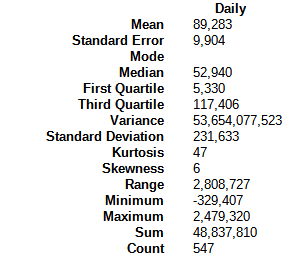
Here are some descriptive statistics, for numbers geeks.
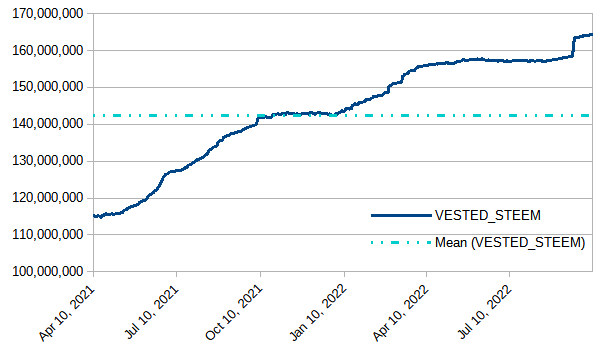
VESTED STEEM
Today's observed value was 164,233,035, which is up by ~158K from last week's observed value. The graph retains a barely perceptible upslope.
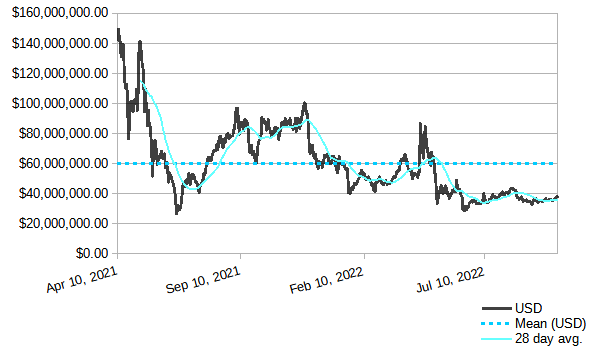
Modeled value of powered-up STEEM in terms of USD
In terms of USD, we saw a weekly increase of about two million dollars, or almost 6%. The value is still below the long-term mean, and holds above its recent low near $34 million. It also remains above the low of ~27 million from June 22, 2021.
Modeled value of powered-up STEEM in terms of Tron (TRX)
Powered-up STEEM gained ground by about 25 million tokens against TRX or a bit over 4 1/3%.
Modeled value of powered-up STEEM in terms of Steem Dollars
Up by about 374K SBDs or a bit over 2 1/2%
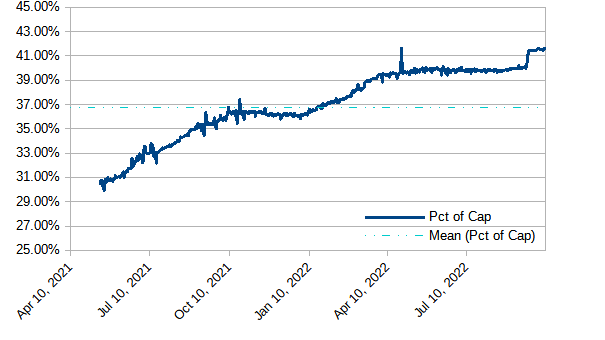
Modeled value of powered-up STEEM as a percentage of Steem's market cap
After today's observed value of 41.58%, the graph was basically flat for the week. We have now seen 21 consecutive days above 41%; 188 consecutive days above 39%; 252 consecutive days above 37%; 379 consecutive days above 35%; and 442 straight days above 1/3. Will it hold above 41%? Will it climb above 42%
Modeled value of powered-up STEEM in terms of bitcoin (BTC)
Up by about 80 BTC, or 3.34% during the week.
Modeled value of powered-up STEEM in terms of Ethereum
Powered-up STEEM advanced by roughly 1,000 ETH, or around 3 3/4%.
Modeled value of powered-up STEEM in terms of LTC
Gained ground by about 29K, or a bit over 4 1/4%. Still running above the historical average.
Daily Powerdown Activity
Here is graph with data from steemdb.io to show daily completed and pending powerdown activity. With 458K in completed powerdowns last week and 381K pending (both measured from Sunday through Saturday), we can expect powerdowns to decrease next week by about 17% or more.
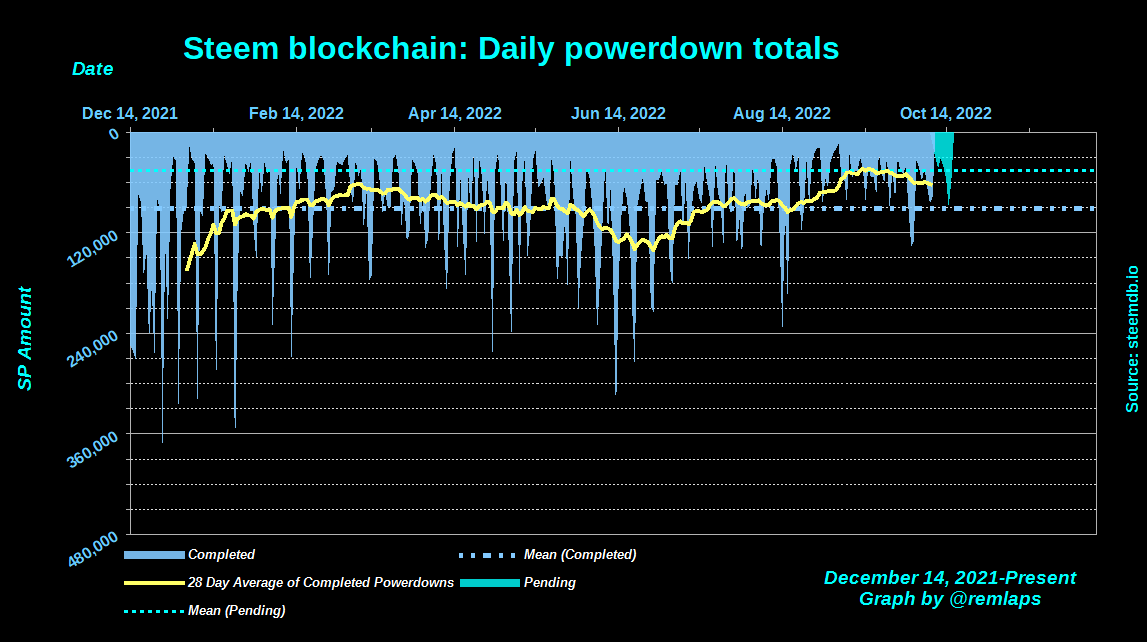
The horizontal lines are the average values for completed (blue) and pending (cyan) powerdowns, and the yellow line is a 28 day moving average of completed powerdowns. "Pending" numbers now come from the Steemit API, not from steemdb.io.
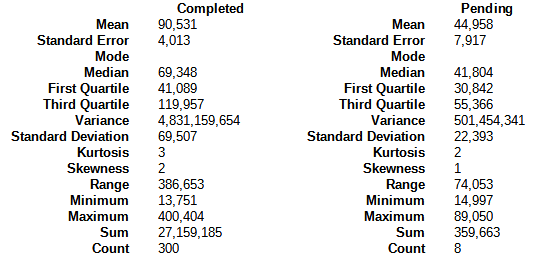
Here are some descriptive statistics for the numbers geeks
| And with a total of 1,313 pending power downs (up from 1,205 last week), here are the times, dates, and amounts of the top-10 |
|---|
1 2022-10-15T05:20:18 - 123,985,412 MVESTS, 69,012 STEEM
2 2022-10-16T16:02:09 - 55,960,417 MVESTS, 31,149 STEEM
3 2022-10-11T12:51:48 - 29,427,358 MVESTS, 16,380 STEEM
4 2022-10-09T23:57:27 - 23,705,891 MVESTS, 13,195 STEEM
5 2022-10-14T16:15:57 - 13,071,148 MVESTS, 7,276 STEEM
6 2022-10-14T12:05:51 - 11,249,997 MVESTS, 6,262 STEEM
7 2022-10-13T19:30:51 - 11,019,911 MVESTS, 6,134 STEEM
8 2022-10-13T19:47:09 - 8,499,529 MVESTS, 4,731 STEEM
9 2022-10-16T15:32:48 - 7,213,137 MVESTS, 4,015 STEEM
10 2022-10-13T21:22:33 - 6,845,010 MVESTS, 3,810 STEEM
Notes
- Reference prices for STEEM and other tokens are downloaded from coingecko.com
Previous posts
- Steem Total Value Powered Up - $34 million - July 3, 2022
- Steem Total Value Powered Up - $37 million - July 10, 2022
- Steem Total Value Powered Up - $36 million - July 17, 2022
- Steem Total Value Powered Up - $38 million - July 24, 2022
- Steem Total Value Powered Up - $41 million - July 31, 2022
- Steem Total Value Powered Up - $41 million - August 7, 2022
- Steem Total Value Powered Up - $43 million - August 14, 2022
- Steem Total Value Powered Up - $38 million - August 21, 2022
- Steem Total Value Powered Up - $36 million - August 28, 2022
- Steem Total Value Powered Up - $37 million - September 11, 2022
- Steem Total Value Powered Up - $36 million - September 18, 2022
- Steem Total Value Powered Up - $36 million - September 25, 2022
- Steem Total Value Powered Up - $35 million - October 2, 2022
- Steem Total Value Powered Up - $38 million - October 9, 2022
For links from 2021 and the first half of 2022, see these posts:
- Steem Total Value Powered Up - $67 million - January 2,
20212022 - Steem Total Value Powered Up - $36 million - June 26, 2022
- Steem Total Value Powered Up - $36 million - June 26, 2022

Pixabay license, source
Reminder
Visit the /promoted page and #burnsteem25 to support the inflation-fighters who are helping to enable decentralized regulation of Steem token supply growth.
The current economy is on the tightrope, however the price of some cryptocurrencies such as steem is maintained and even increases, but the volatility continues and will continue
This post has been featured in the latest edition of Steem News...
The report shows that there is progress in increasing the value. I think the cost will continue to grow! I am glad that the price went up a little on the coin.
Now the market is in one at the same low time. But steem and trx please with their ups! I think everything should continue at the same pace.
I think the 158K SP increase is very important in this period. Such generous rises in these days when we are in a bear period are promising for the next period.