Steem Total Value Powered Up - $35 million - October 2, 2022
This is next in my series of posts reviewing the amount and value of powered up STEEM on the Steem blockchain. For previous posts, see the end of this entry.
Noteworthy in the last week |
|---|
- Week over week, the number of powered up STEEM increased by about 400K SP, or 1/4%.
- Over the course of the week, we saw five daily increases and four new highs in the number of staked STEEM.
- The modeled value lost ground against all comparison values, except for SBDs. Changes ranged from -4.6% against TRX to about 2% against SBD.
- In terms of all comparison values except for TRX and USD, the modeled value remains above its January 1 baseline.
- In terms of all comparison tokens except TRX and USD, the modeled value is above its long term mean.
- This week (Sunday through Saturday) saw a total of 475K STEEM powered down, which is an increase of 27% as compared to last week's 374K STEEM.
Here are the numbers as-of a few minutes ago |
|---|
Total value locked in powered-up STEEM (USD): $35,449,232.68
STEEM market cap $85,095,109.61
Locked value in terms of other tokens:
| token | price | locked value equivalent | Jan 1, 2022 | pct of Jan 1 baseline |
|---|---|---|---|---|
| tron | $0.06 | 573,965,102 | 809,173,538 | 70.93% |
| steem-dollars | $2.43 | 14,588,161 | 11,284,131 | 129.28% |
| bitcoin | $19,295.62 | 1,837 | 1,300 | 141.35% |
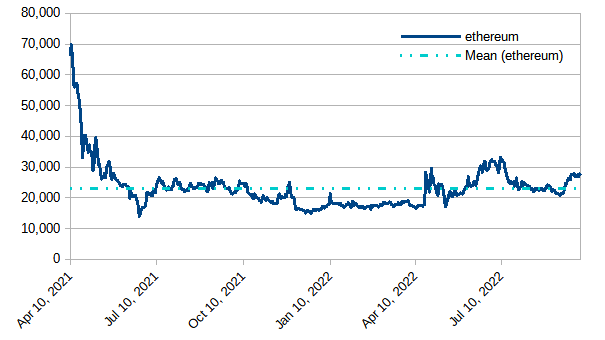
| ethereum | $1,308.91 | 27,083 | 16,501 | 164.13% |
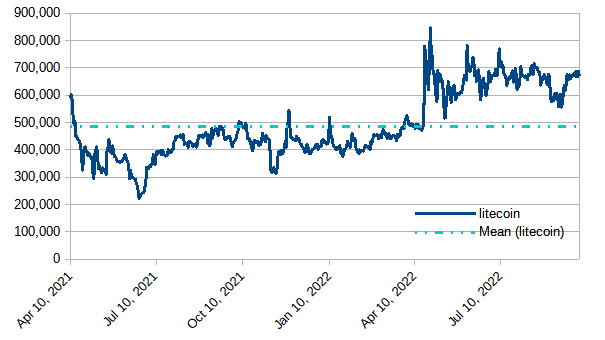
| litecoin | $53.08 | 667,845 | 411,561 | 162.27% |
| steem | $0.22 | 164,088,710 | 142,930,214 | 114.80% |
| USD | $1.00 | 35,449,233 | 61,837,042 | 57.33% |
|
|---|
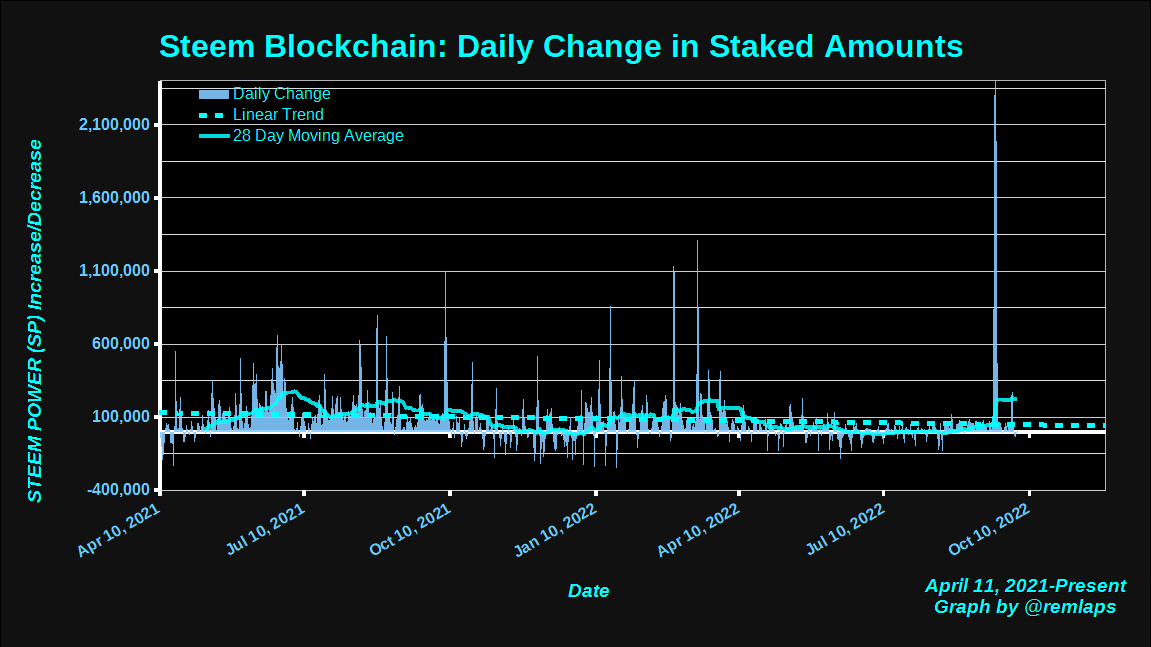
Daily Changes
Here is a chart of daily changes in powered-up STEEM from April 11, 2021 to present. The graph also includes a linear trend line and a 28 day moving average.
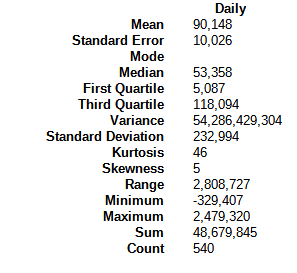
Here are some descriptive statistics, for numbers geeks.
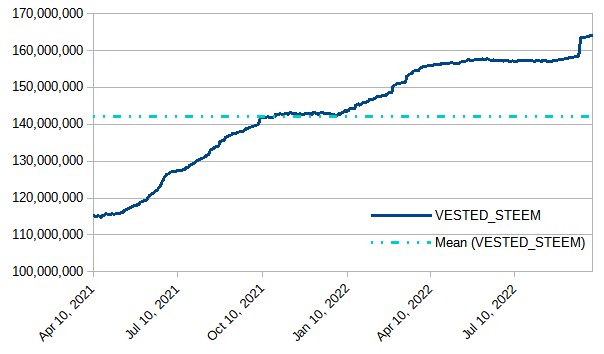
VESTED STEEM
Despite this week's increase in powerdown amounts, most of the weekly powerdown activity was offset by a 377K daily increase on Thursday (September 29) . Today's observed value was 164,075,070, which is up by ~410K from last week's observed value.
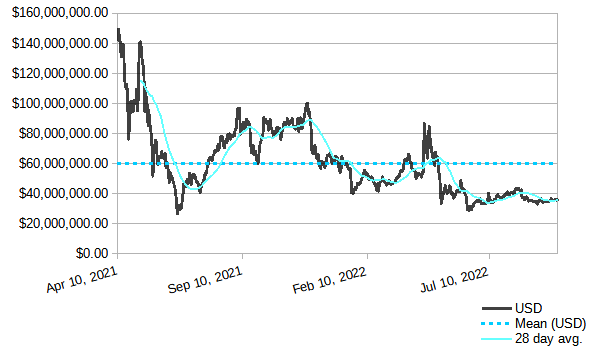
Modeled value of powered-up STEEM in terms of USD
In terms of USD, we saw a weekly decrease of about 550 thousand dollars, or a bit over 1 1/2%. The value is still below the long-term mean, and holds above its recent low near $34 million. It also remains above the low of ~27 million from June 22, 2021.
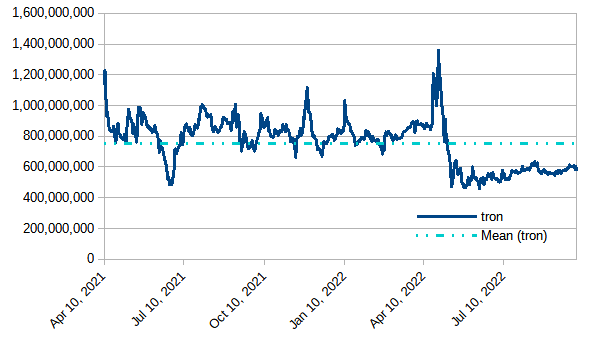
Modeled value of powered-up STEEM in terms of Tron (TRX)
Powered-up STEEM lost ground by about 28 million tokens against TRX or a bit over 4 1/2%.
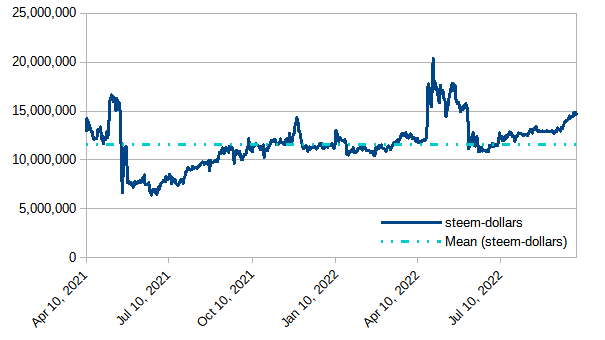
Modeled value of powered-up STEEM in terms of Steem Dollars
Up by about 301K SBDs or 2%
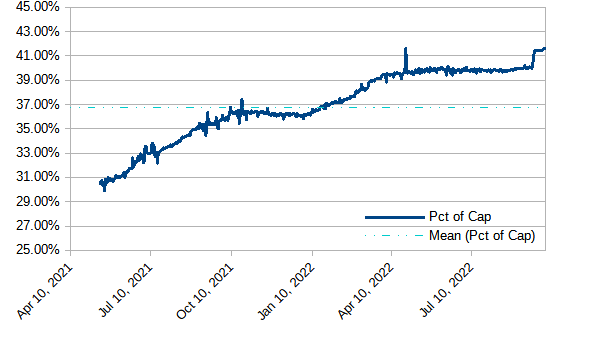
Modeled value of powered-up STEEM as a percentage of Steem's market cap
After today's observed value of 41.53%, we have now seen 14 consecutive days above 41%; 181 consecutive days above 39%; 245 consecutive days above 37%; 372 consecutive days above 35%; and 435 straight days above 1/3. Will it hold above 41%? Will it climb above 42%
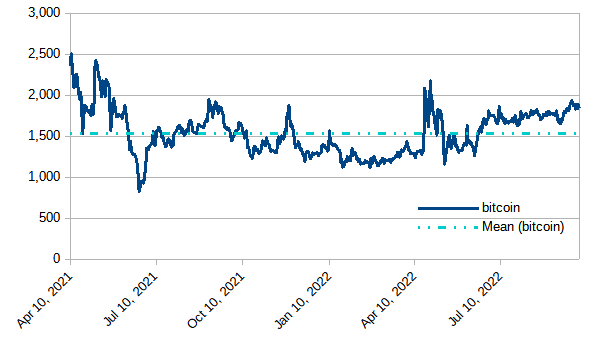
Modeled value of powered-up STEEM in terms of bitcoin (BTC)
Lost ground by about 55 BTC, or 3% during the week.
Modeled value of powered-up STEEM in terms of Ethereum
Powered-up STEEM lost ground by about 574 ETH, or around 2%.
Modeled value of powered-up STEEM in terms of LTC
Down by about 1,800, or 1/4%. Still running above the historical average.
Daily Powerdown Activity
Here is graph with data from steemdb.io to show daily completed and pending powerdown activity. With 475K in completed powerdowns last week and 484K pending (both measured from Sunday through Saturday), we can expect powerdowns to increase next week by about 2% or less.
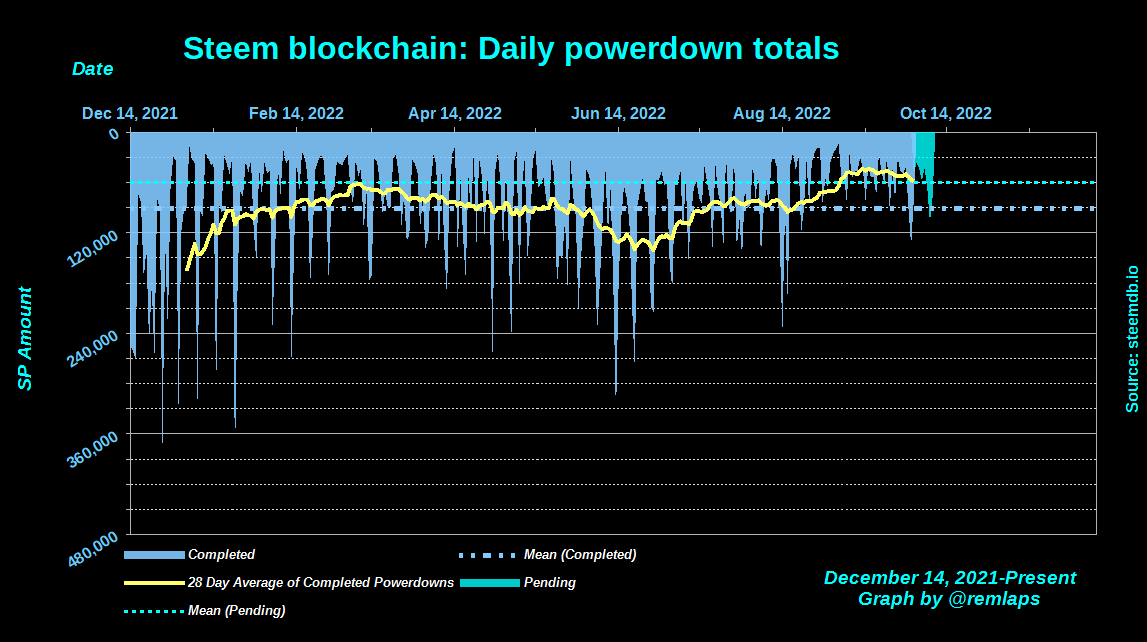
The horizontal lines are the average values for completed (blue) and pending (cyan) powerdowns, and the yellow line is a 28 day moving average of completed powerdowns. "Pending" numbers now come from the Steemit API, not from steemdb.io.
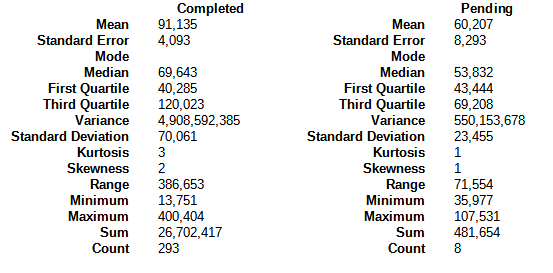
Here are some descriptive statistics for the numbers geeks
| And with a total of 1205 pending power downs, here are the times, dates, and amounts of the top-10 |
|---|
1 2022-10-08T05:20:18 - 123,985,412 MVESTS, 68,972 STEEM
2 2022-10-09T16:02:03 - 69,577,169 MVESTS, 38,705 STEEM
3 2022-10-02T23:49:24 - 60,808,843 MVESTS, 33,828 STEEM
4 2022-10-07T14:51:42 - 46,745,521 MVESTS, 26,004 STEEM
5 2022-10-08T05:20:45 - 41,262,917 MVESTS, 22,954 STEEM
6 2022-10-04T12:51:48 - 29,427,358 MVESTS, 16,370 STEEM
7 2022-10-02T23:57:27 - 23,705,891 MVESTS, 13,187 STEEM
8 2022-10-05T08:39:27 - 23,031,953 MVESTS, 12,813 STEEM
9 2022-10-09T16:58:42 - 19,358,194 MVESTS, 10,769 STEEM
10 2022-10-06T16:39:06 - 13,445,730 MVESTS, 7,480 STEEM
Notes
- Reference prices for STEEM and other tokens are downloaded from coingecko.com
Previous posts
- Steem Total Value Powered Up - $34 million - July 3, 2022
- Steem Total Value Powered Up - $37 million - July 10, 2022
- Steem Total Value Powered Up - $36 million - July 17, 2022
- Steem Total Value Powered Up - $38 million - July 24, 2022
- Steem Total Value Powered Up - $41 million - July 31, 2022
- Steem Total Value Powered Up - $41 million - August 7, 2022
- Steem Total Value Powered Up - $43 million - August 14, 2022
- Steem Total Value Powered Up - $38 million - August 21, 2022
- Steem Total Value Powered Up - $36 million - August 28, 2022
- Steem Total Value Powered Up - $37 million - September 11, 2022
- Steem Total Value Powered Up - $36 million - September 18, 2022
- Steem Total Value Powered Up - $36 million - September 25, 2022
- Steem Total Value Powered Up - $35 million - October 2, 2022
For links from 2021 and the first half of 2022, see these posts:
- Steem Total Value Powered Up - $67 million - January 2,
20212022 - Steem Total Value Powered Up - $36 million - June 26, 2022
- Steem Total Value Powered Up - $36 million - June 26, 2022

Pixabay license, source
Reminder
Visit the /promoted page and #burnsteem25 to support the inflation-fighters who are helping to enable decentralized regulation of Steem token supply growth.
Despite the rather low (but constant) price of STEEM, it is a little reassuring that STEEM has gained around 150% against BTC or ETH since the beginning of the year.
In this sense, STEEM has been able to escape the general crypto trend a little. It remains exciting to see how the current activities around Steemit will affect the coming weeks/months.
Thanks for the clickable pictures, by the way. :-)
Agreed. As bad as the market has been, I'm glad that STEEM has been holding its own against some of the most popular coins, and we're starting to see some things in the ecosystem that seem promising.
You're welcome. Now if I could just do something about being unable to see the right hand side of the screen on my cell phone.
It's not displayed correctly for me either.
This is a problem with some posts. michelangelo3 once found out that it occurs, for example, in posts with code tags when the lines are a bit longer.
But I can't say why this is the case in your post.
It started when I extended the table from three columns to five columns, in order to add the January 1 baselines. I noticed that the issue was included in michelangelo3's community proposal, so hopefully someone will address it.
Two workarounds are to switch to desktop mode, or in the cell phone Brave browser, it gives an option for "simplified display" or something like that. It's an annoyance, but not enough of annoyance for me to switch back to the 3-column table. ;-)
Almost 41.658% steem is locked in power up system as to total marketcap (based on USD). This is really huge amoun in the staked system. How this amount on ther bloackchain? Can anyone say?
The price of steem has remained stable, well some days, but I have seen that the rewards are not the same, but I will continue working and we will see what happens
This post has been featured in the latest edition of Steem News...
It's good that all values are above the level on January 1. This is a decent indicator for a coin.
This week's serious and significant increase is very important. 400K steem is a great piece in my opinion. Of course, the important thing is to increase it. In my opinion, the number of SP steems should be more than the amount of inflation. That's when success will come.
It will be more this month, powering up will be increased