Steem Total Value Powered Up - $37 million - March 5, 2023
This is next in my series of posts reviewing the amount and value of powered up STEEM on the Steem blockchain. For previous posts, see the end of this entry.
Noteworthy in the last week |
|---|
- Week over week, the number of powered up STEEM increased by about 535K SP, or 0.32%.
- Over the course of the week, we saw six daily increases and four new highs in the number of staked STEEM.
- The modeled value of powered-up (staked) STEEM lost ground against all other comparison tokens. Changes ranged from -9.69% against USD to -4.39% against SBD.
- Compared to the January 1, 2023 baseline, the modeled value is higher than all comparison tokens.
- This week saw a total of 692K STEEM powered down, which is up by about 20% from last week's 574K STEEM (both measured from Sunday through Saturday).
- After 8 consecutive weekly increases in terms of the modeled USD value, this was the first weekly decline since January 1.
Here are the numbers as-of a few minutes ago |
|---|
Total value locked in powered-up STEEM (USD): $37,277,002.93
External STEEM market cap (coingecko) $93,940,173.03
Internal STEEM market cap (median_price * current_supply) $91,259,800.00
Locked value in terms of other tokens:
| token | price | locked value equivalent | Jan 1, 2023 | pct of Jan 1 baseline |
|---|---|---|---|---|
| tron | $0.07 | 550,612,294 | 445,758,870 | 123.52% |
| steem-dollars | $2.90 | 12,854,138 | 11,564,498 | 111.15% |
| bitcoin | $22,413.00 | 1,663 | 1,477 | 112.63% |
| ethereum | $1,565.56 | 23,810 | 20,406 | 116.68% |
| litecoin | $90.16 | 413,453 | 344,287 | 120.09% |
| steem | $0.22 | 170,012,784 | 166,882,703 | 101.88% |
| USD | $1.00 | 37,277,003 | 24,516,738 | 152.05% |
|
|---|
Daily Changes
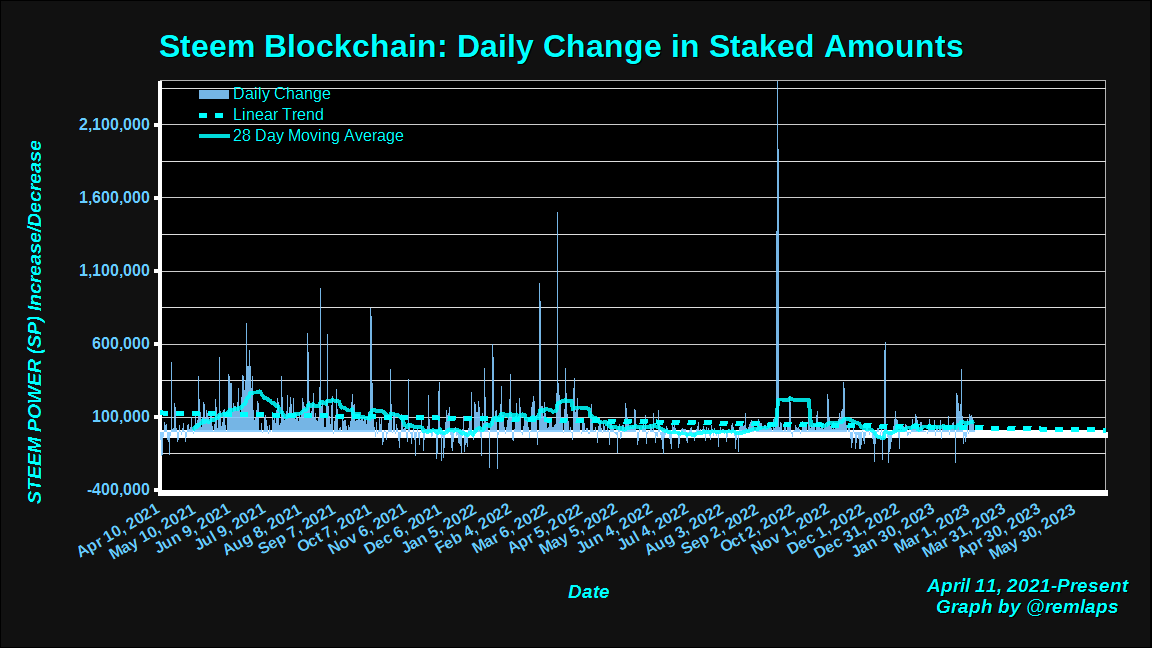
Here is a chart of daily changes in powered-up STEEM from April 11, 2021 to present. The graph also includes a linear trend line and a 28 day moving average.
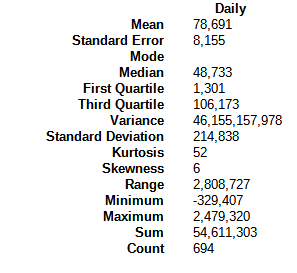
Here are some descriptive statistics, for numbers geeks.
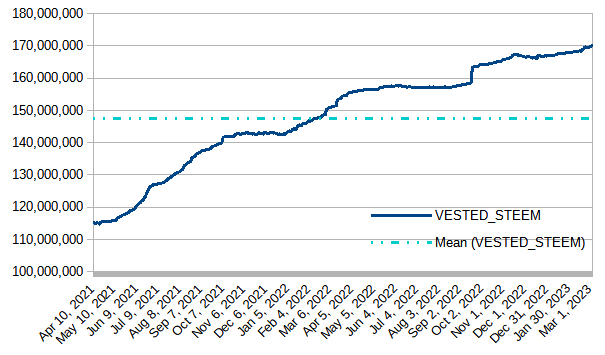
VESTED STEEM
Today's observed value was 170,006,528, which is up by about 500K STEEM, or about 1/3% from last week's observed value. The graph shows a gently increasing upslope during recent weeks.
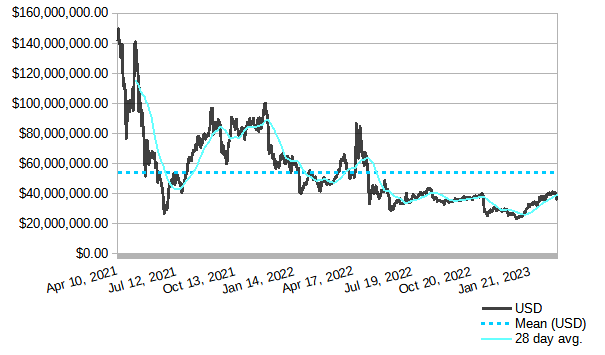
Modeled value of powered-up STEEM in terms of USD
In terms of USD, today's value - slightly above $37 million - remained above the December 30, 2022 low of $23,718,335.58 but declined by about $4 million, nearly 10% off of last week's value. This was the first weekly decline after eight consecutive weekly increases.
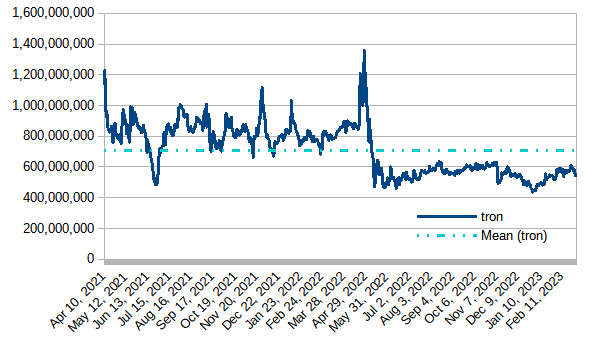
Modeled value of powered-up STEEM in terms of Tron (TRX)
Powered-up STEEM dropped against TRX by about 46 million tokens or roughly 7 1/2%.
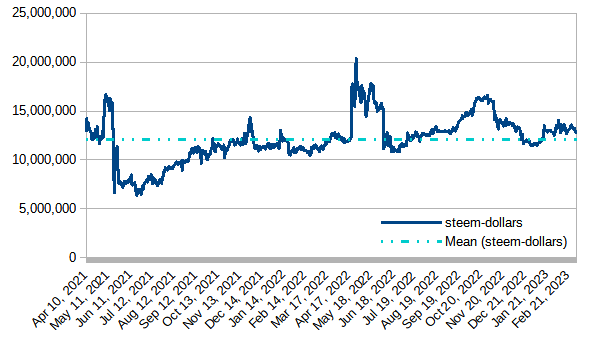
Modeled value of powered-up STEEM in terms of Steem Dollars
Powered-up STEEM lost ground by about 600K SBDs over the last week, which is a bit over 4%.
Modeled value of powered-up STEEM as a percentage of Steem's market cap
After today's observed value of 39.69% the graph was basically flat for the past thirteen weeks. We have now seen 335 consecutive days above 39%; 399 consecutive days above 37%; 526 consecutive days above 35%; and 589 straight days above 1/3. Will it hold above 39? Will it climb above 40%?
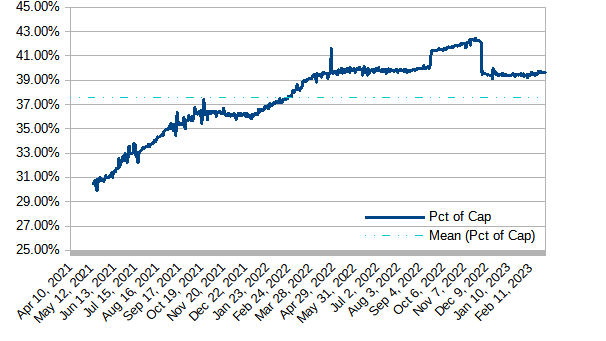
*As previously reported, the big drop on December 4, 2022 was due to a correction in the value that Coingecko is getting for its circulating supply. Numbers before December 4, 2022 were based on an artificially low supply measurement.
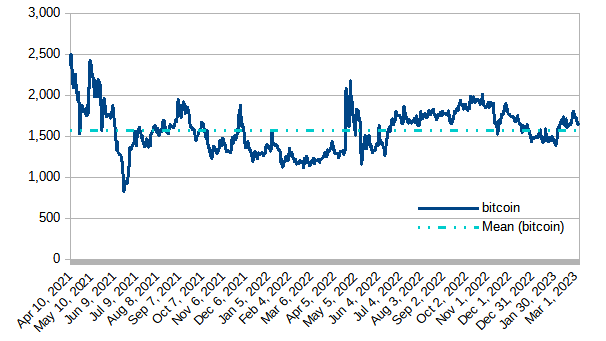
Modeled value of powered-up STEEM in terms of bitcoin (BTC)
Powered-up STEEM moved down by 105 BTC, which is nearly 6%.
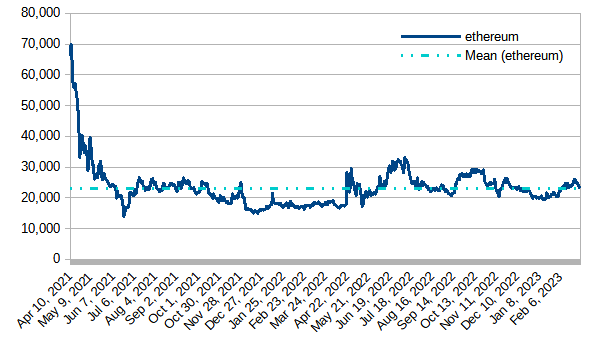
Modeled value of powered-up STEEM in terms of Ethereum
Powered-up STEEM declined in the last seven days by ~1,700 ETH, or a bit under 7%.
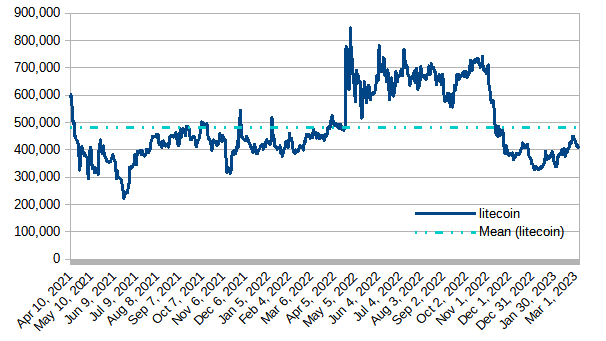
Modeled value of powered-up STEEM in terms of LTC
In the last 7 days, powered-up STEEM lost ground against LTC by about 25K LTC, which is about 5 1/2%.
Daily Powerdown Activity
Here is graph with data from steemdb.io to show daily completed and pending powerdown activity. With 692K in completed powerdowns last week and 537K pending (both measured from Sunday through Saturday[GMT time zone]), we might expect powerdowns to decrease next week by about 22% or more.
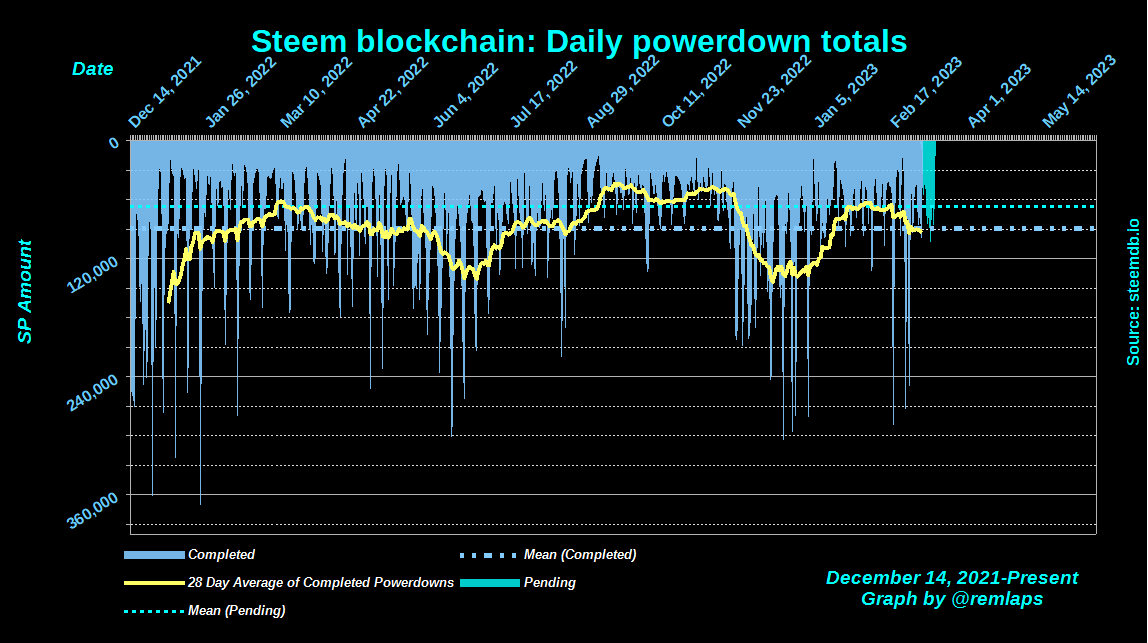
The horizontal lines are the average values for completed (blue) and pending (cyan) powerdowns, and the yellow line is a 28 day moving average of completed powerdowns. "Pending" numbers now come from the Steemit API, not from steemdb.io.
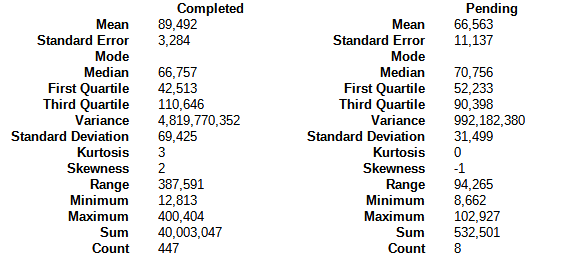
Here are some descriptive statistics for the numbers geeks
| And with a total of 1,023 pending power downs (down from 1,025 last week), here are the times, dates, and amounts of the top-10 |
|---|
1 2023-03-07T13:01:15 - 120,039,242 VESTS, 67,603 STEEM
2 2023-03-08T20:09:54 - 77,310,558 VESTS, 43,539 STEEM
3 2023-03-12T15:05:18 - 52,903,125 VESTS, 29,794 STEEM
4 2023-03-10T22:31:36 - 44,422,457 VESTS, 25,017 STEEM
5 2023-03-11T03:32:24 - 35,874,306 VESTS, 20,203 STEEM
6 2023-03-06T00:52:36 - 26,814,574 VESTS, 15,101 STEEM
7 2023-03-10T01:10:30 - 26,634,740 VESTS, 15,000 STEEM
8 2023-03-11T18:12:51 - 25,674,195 VESTS, 14,459 STEEM
9 2023-03-12T12:00:42 - 23,757,942 VESTS, 13,380 STEEM
10 2023-03-09T10:34:12 - 22,858,150 VESTS, 12,873 STEEM
Notes
- Reference prices for STEEM and other tokens are downloaded from coingecko.com
Previous posts
- Steem Total Value Powered Up - $37 million - March 5, 2023
- Steem Total Value Powered Up - $41 million - February 26, 2023
- Steem Total Value Powered Up - $40 million - February 19, 2023
- Steem Total Value Powered Up - $38 million - February 12, 2023
- Steem Total Value Powered Up - $36 million - February 5, 2023
- Steem Total Value Powered Up - $35 million - January 29, 2023
- Steem Total Value Powered Up - $33 million - January 22, 2023
- Steem Total Value Powered Up - $30 million - January 15, 2023
- Steem Total Value Powered Up - $25 million - January 8, 2023
- Steem Total Value Powered Up - $24 million - January 1, 2023
For links from 2021 and 2022, see these posts:
- Steem Total Value Powered Up - $67 million - January 2,
20212022 - Steem Total Value Powered Up - $36 million - June 26, 2022
- Steem Total Value Powered Up - $26 million - December 18, 2022

Pixabay license, source
Reminder
Visit the /promoted page and #burnsteem25 to support the inflation-fighters who are helping to enable decentralized regulation of Steem token supply growth.
Good analysis thanks. The amount of buff this week is good in my opinion. The number of boosts will gradually increase as the Steem price drops.
Now bitcoin has gone down, because of this, the total volume of steem in dollar terms will be even lower than shown on your chart.
What about steem and sbd's inflation rate? Is it higher than usual cryto rate or not?
A huge amoubt of steem is in power down section. Is the users are leaving steem or for other reasons???
Seems like the powerdowns rise and fall periodically. I'm not sure that there's a single reason for it. Just some of the larger accounts moving funds around. In general, I think overall usage declines when prices are lower and rises when prices are higher.
The yellow line, according to what you say, shows many powerdowns in that period of time, I think it may be due to the price increase that many of us take advantage of
I just got back to posting on Steemit, but I noticed that a large number of accounts have been inactive for 3 or 4 years. What is the reason?
Welcome back!
There was a lot of drama back in 2020, and the chain forked. A consortium of the larger accounts went to the forked chain, and took control over there.