Steem Total Value Powered Up - $36 million - April 2, 2023
This is next in my series of posts reviewing the amount and value of powered up STEEM on the Steem blockchain. For previous posts, see the end of this entry.
Noteworthy in the last week |
|---|
- Week over week, the number of powered up STEEM increased by about 600 thousand SP, or 0.35%.
- Over the course of the week, we saw six daily increases and six new highs in the number of staked STEEM.
- The modeled value of powered-up (staked) STEEM gained ground against SBD and LTC; it lost ground against USD and TRX, and it was unchanged against BTC.
- Changes ranged from -2% against TRX to +51/2% against SBD.
- Compared to the January 1, 2023 baseline, the modeled value is higher than all comparison tokens, except for BTC and ETH.
- This week's completed powerdowns were reported at 426K, which is a decline of almost 17% from last week's 511K.
Here are the numbers as-of a few minutes ago |
|---|
Total value locked in powered-up STEEM (USD): $36,202,663.22
External STEEM market cap (coingecko) $90,331,774.54
Internal STEEM market cap (median_price * current_supply) $91,303,800.00
Locked value in terms of other tokens:
| token | price | locked value equivalent | Jan 1, 2023 | pct of Jan 1 baseline |
|---|---|---|---|---|
| tron | $0.07 | 552,299,245 | 445,758,870 | 123.90% |
| steem-dollars | $2.87 | 12,614,168 | 11,564,498 | 109.08% |
| bitcoin | $28,142.00 | 1,286 | 1,477 | 87.10% |
| ethereum | $1,792.96 | 20,191 | 20,406 | 98.95% |
| litecoin | $91.77 | 394,493 | 344,287 | 114.58% |
| steem | $0.21 | 172,653,437 | 166,882,703 | 103.46% |
| USD | $1.00 | 36,202,663 | 24,516,738 | 147.66% |
|
|---|
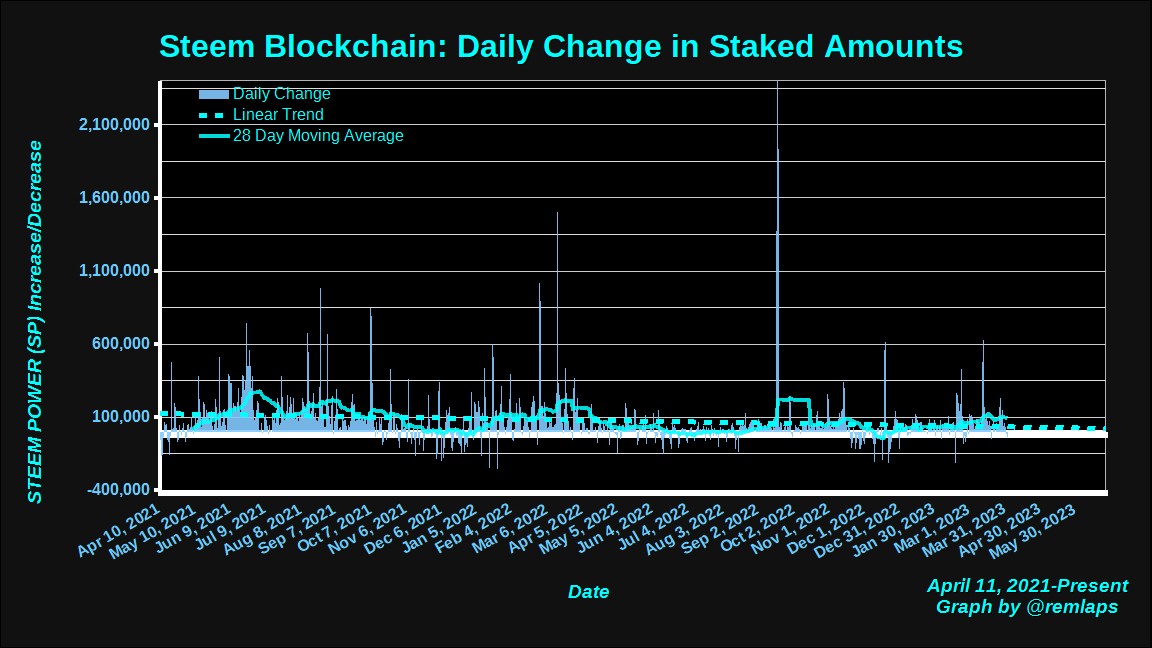
Daily Changes
Here is a chart of daily changes in powered-up STEEM from April 11, 2021 to present. The graph also includes a linear trend line and a 28 day moving average. The 28 day moving average has peeled away from the 0 line for the first time in a while, and it's running near 100K per day.
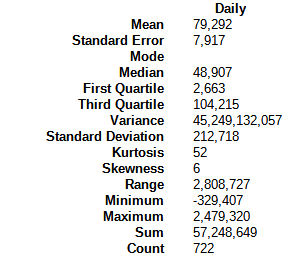
Here are some descriptive statistics, for numbers geeks.
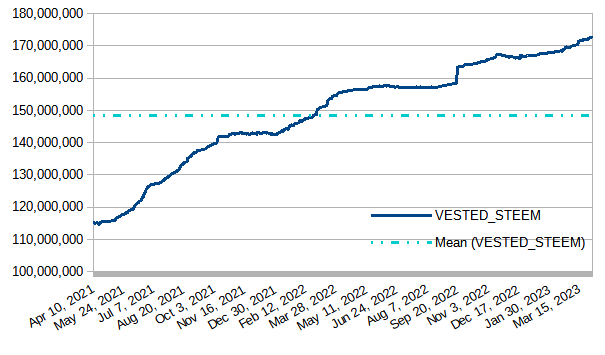
VESTED STEEM
Today's observed value was 172,643,874, which is up by about 600K STEEM, or about 1/3% from last week's observed value. The graph shows a gentle upslope.
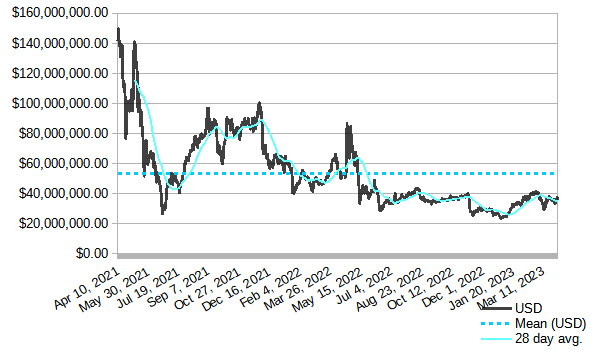
Modeled value of powered-up STEEM in terms of USD
In terms of USD, today's value - above $36 million - remains higher than the December 30, 2022 low of $23,718,335.58. It dropped by about $300K, about 4/5% from last week's value.
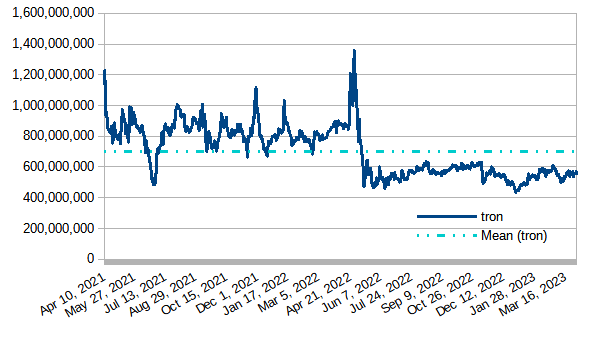
Modeled value of powered-up STEEM in terms of Tron (TRX)
Powered-up STEEM sank against TRX by about 11 million tokens or roughly 2%.
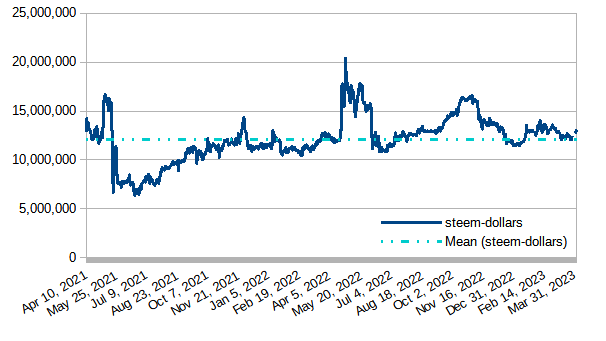
Modeled value of powered-up STEEM in terms of Steem Dollars
Powered-up STEEM gained ground by about 660K SBDs over the last week, which is a bit under 5 1/2%.
Modeled value of powered-up STEEM as a percentage of Steem's market cap
After today's observed value of 40.11% the graph is showing a slight upslope. We have now seen 9 consecutive days above 40%, 363 consecutive days above 39%; 427 consecutive days above 37%; 554 consecutive days above 35%; and 617 straight days above 1/3.
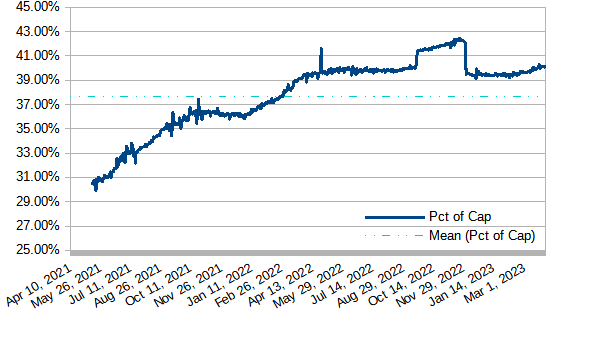
*As previously reported, the big drop on December 4, 2022 was due to a correction in the value that Coingecko is getting for its circulating supply. Numbers before December 4, 2022 were based on an artificially low supply measurement.
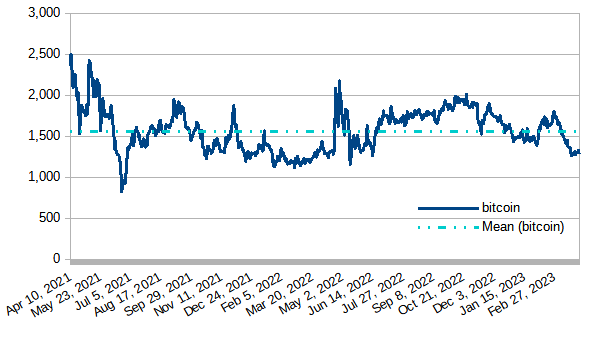
Modeled value of powered-up STEEM in terms of bitcoin (BTC)
Powered-up STEEM was unchanged at 1279 BTC.
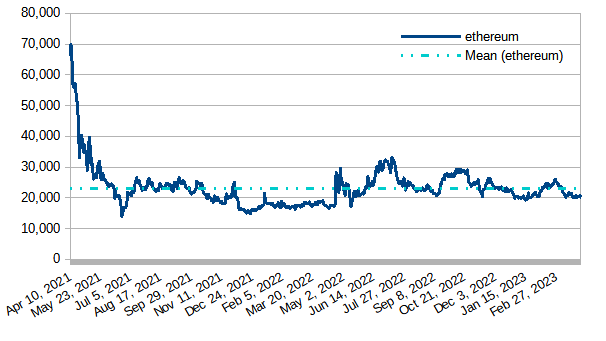
Modeled value of powered-up STEEM in terms of Ethereum
Powered-up STEEM lost ground in the last seven days by 500 ETH, or a bit under 2 1/2%.
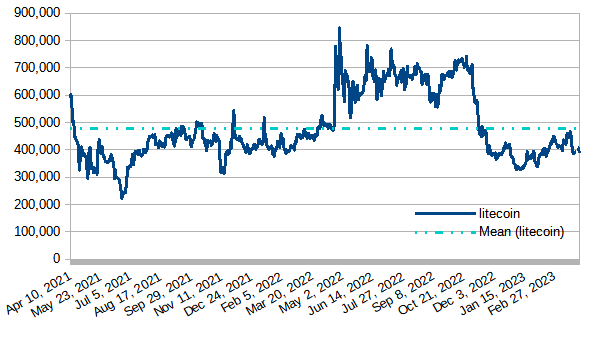
Modeled value of powered-up STEEM in terms of LTC
In the last 7 days, powered-up STEEM gained against LTC by about 17K LTC, which is about 4 1/3%.
Daily Powerdown Activity
Here is graph with data from steemdb.io to show daily completed and pending powerdown activity. The graph shows 427K in completed powerdowns last week and 529K pending (both measured from Sunday through Saturday[GMT time zone]). This represents a potential increase in powerdowns by about 24% or less.
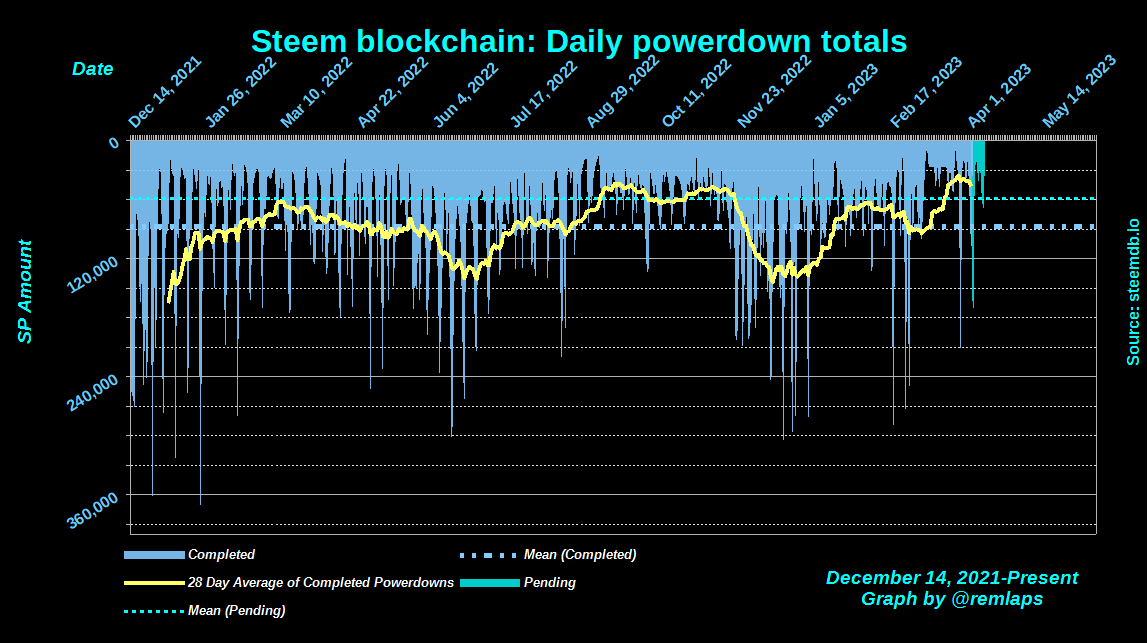
The horizontal lines are the average values for completed (blue) and pending (cyan) powerdowns, and the yellow line is a 28 day moving average of completed powerdowns. "Pending" numbers now come from the Steemit API, not from steemdb.io.
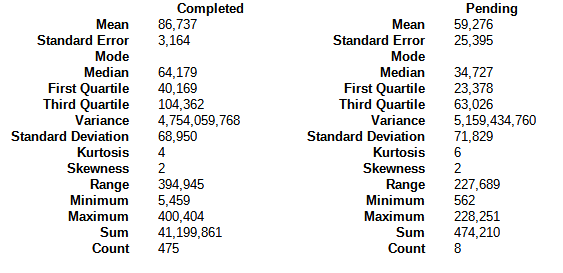
Here are some descriptive statistics for the numbers geeks
| And with a total of 937 pending power downs (down from 980 last week), here are the times, dates, and amounts of the top-10 |
|---|
1 2023-04-03T01:18:06 - 265,032,941 VESTS, 149,585 STEEM
2 2023-04-03T17:02:48 - 70,295,446 VESTS, 39,675 STEEM
3 2023-04-09T15:05:45 - 52,043,392 VESTS, 29,373 STEEM
4 2023-04-09T09:01:15 - 42,912,895 VESTS, 24,220 STEEM
5 2023-04-08T15:11:21 - 27,495,107 VESTS, 15,518 STEEM
6 2023-04-06T02:37:48 - 24,094,750 VESTS, 13,599 STEEM
7 2023-04-08T06:29:15 - 17,902,372 VESTS, 10,104 STEEM
8 2023-04-06T00:51:36 - 14,801,769 VESTS, 8,354 STEEM
9 2023-04-04T16:36:33 - 12,001,365 VESTS, 6,774 STEEM
10 2023-04-08T16:43:27 - 10,638,337 VESTS, 6,004 STEEM
Notes
- Reference prices for STEEM and other tokens are downloaded from coingecko.com
Previous posts
- Steem Total Value Powered Up - $36 million - April 2, 2023
- Steem Total Value Powered Up - $37 million - March 26, 2023
- Steem Total Value Powered Up - $38 million - March 19, 2023
- Steem Total Value Powered Up - $31 million - March 12, 2023
- Steem Total Value Powered Up - $37 million - March 5, 2023
- Steem Total Value Powered Up - $41 million - February 26, 2023
- Steem Total Value Powered Up - $40 million - February 19, 2023
- Steem Total Value Powered Up - $38 million - February 12, 2023
- Steem Total Value Powered Up - $36 million - February 5, 2023
- Steem Total Value Powered Up - $35 million - January 29, 2023
- Steem Total Value Powered Up - $33 million - January 22, 2023
- Steem Total Value Powered Up - $30 million - January 15, 2023
- Steem Total Value Powered Up - $25 million - January 8, 2023
- Steem Total Value Powered Up - $24 million - January 1, 2023
For links from 2021 and 2022, see these posts:
- Steem Total Value Powered Up - $67 million - January 2,
20212022 - Steem Total Value Powered Up - $36 million - June 26, 2022
- Steem Total Value Powered Up - $26 million - December 18, 2022

Pixabay license, source
Reminder
Visit the /promoted page and #burnsteem25 to support the inflation-fighters who are helping to enable decentralized regulation of Steem token supply growth.
Thanks for the analysis. The amount of steem power this week is pretty good.
I care why the coin TRX it started charging late again. I am glad that people are turning on their power more and more. I myself this week made a promotion to 51.004 STEEM that's all I had in my wallet. Received strong support for further growth!
Price of steem changes over time with others coin except btc. Why it is almost same against btc over a course of time????