RE: litecoin
As predicted from the analysis on the 20th April, the Charts are showing a change in direction, the price hit a predicted high of between €124 and €127 actual was €128 before retreating back to a day low of €114 and then settling back into the €119- €123 range .
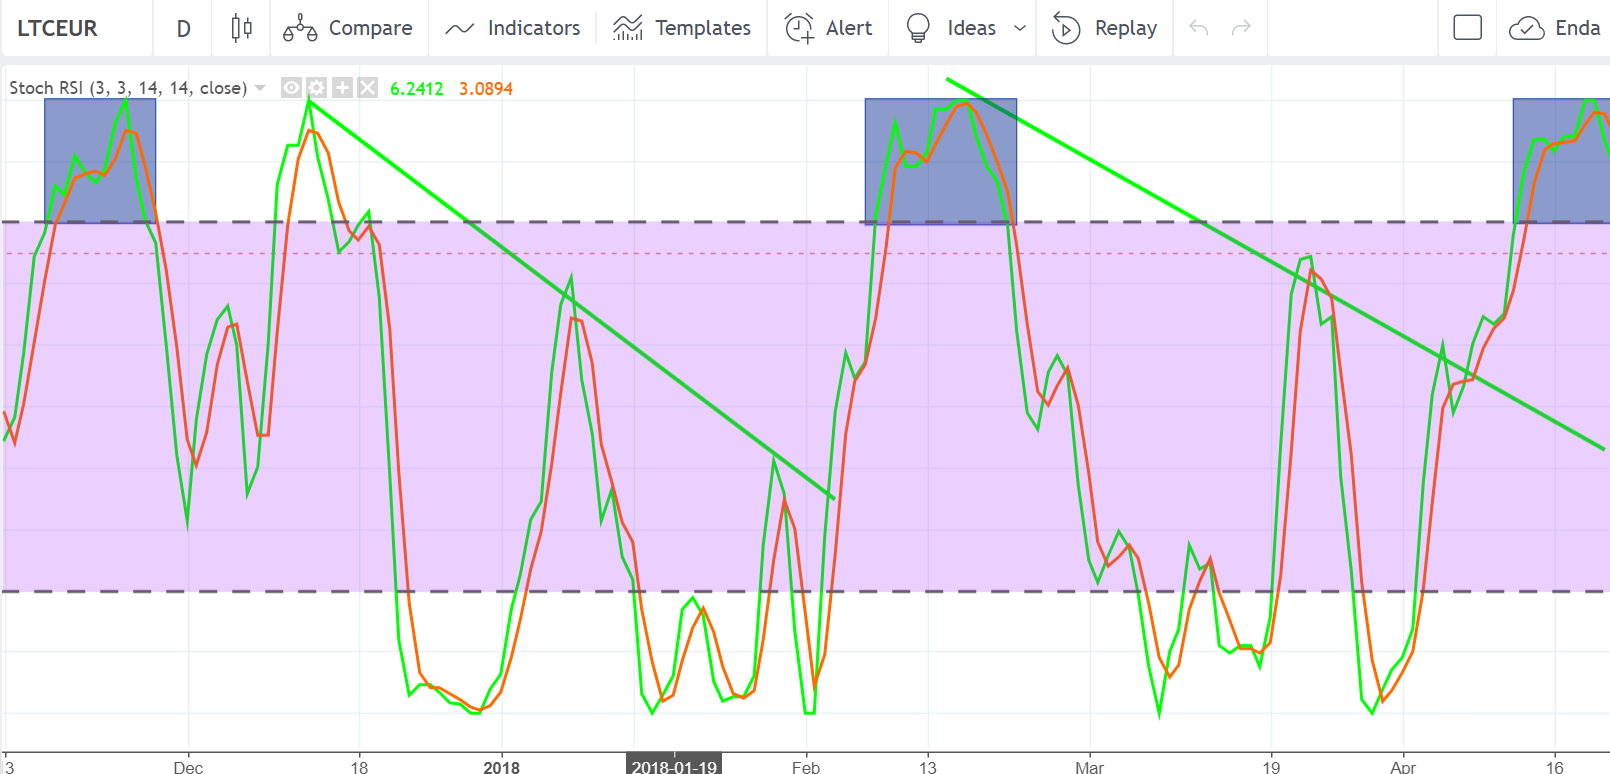
According to the Elliot wave formation this occurrance was in wave 3 to 4, thus suggesting that we are in for another movement in the upwards direction over the coming cycle
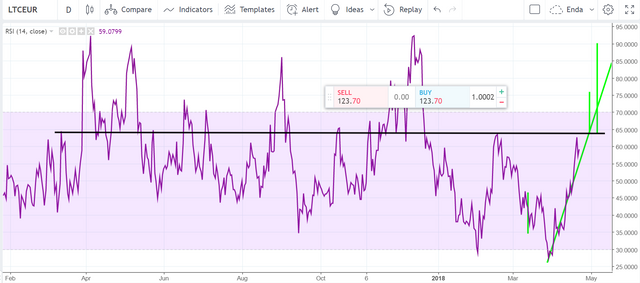
On the RSI indicator , the trend line tested the 64% resistance line( black line) and retreated from this significant indicator, suggesting momentum shift from the market.
![SRSI21stApril2018.PNG]
How this all looks on the Candle stick chart for LTC
![Candle21stApril2018.PNG]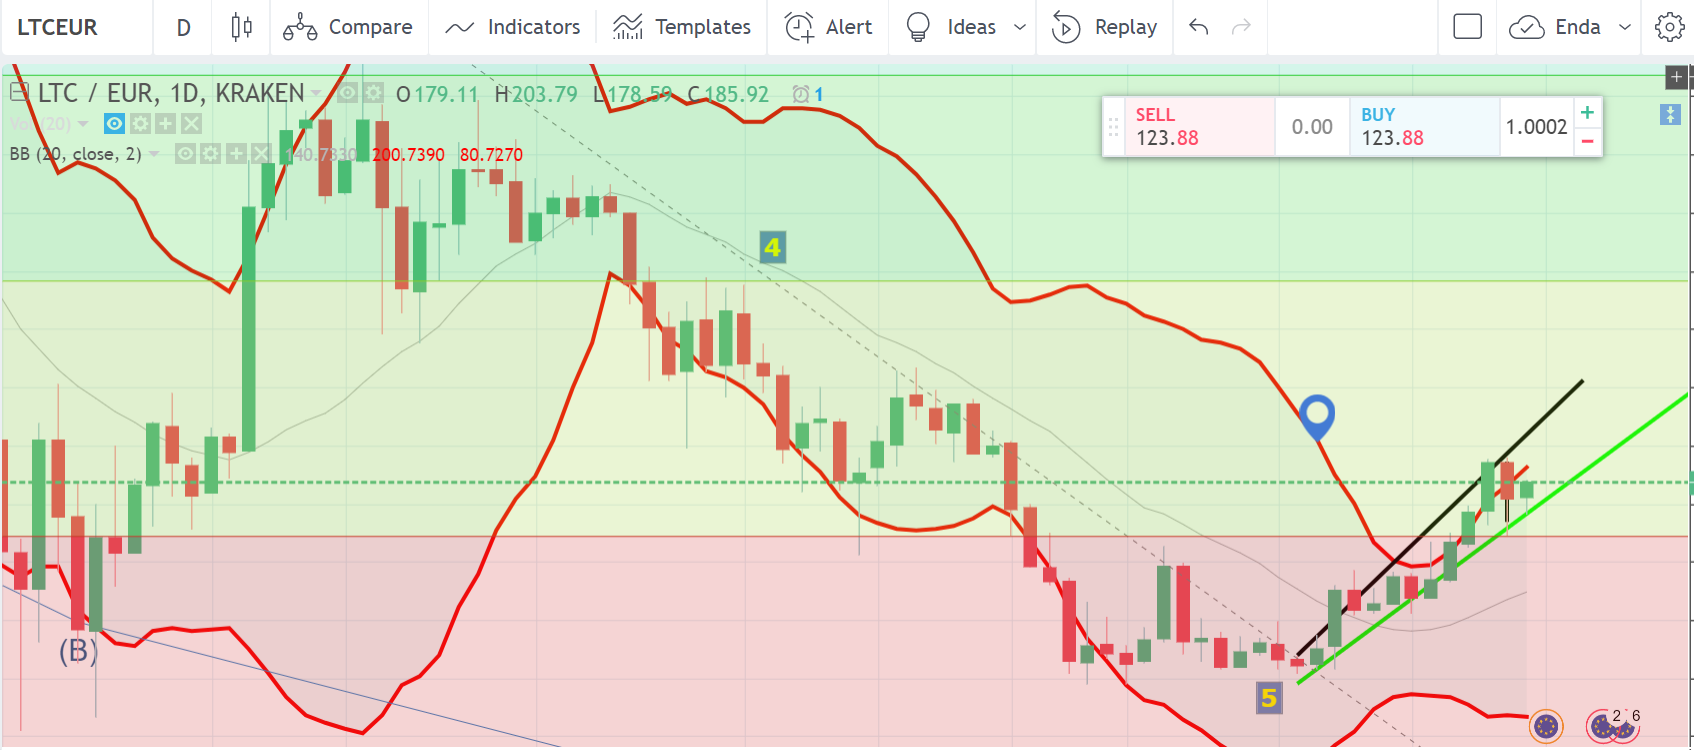
What do the charts hold for the future ,
25th April a potential €140 range with support line of €128
Any directional change negatively will be driven by Market forces (FUD)
Legal Disclaimer: I am not a financial advisor nor is any content in this article presented as financial advice. The information provided in this blog post and any other posts that I make and any accompanying material is for informational purposes only. It should not be considered financial or investment advice of any kind. One should consult with a financial or investment professional to determine what may be best for your individual needs. Plain English: This is only my opinion, make of it what you wish. What does this mean? It means it's not advice nor recommendation to either buy or sell anything! It's only meant for use as informative or entertainment purposes.