Chart of the S&P 500 on August 6, 2016
For those of you who like technical charts or simply are curious where the stock market trend is presently, take a look at this chart and it will blow your mind. This is a 20-year chart where each increment is one month. This past week we are right at the top, blue resistance line that goes all the way back to the year 2000. Looks to me that we are up against the ceiling. 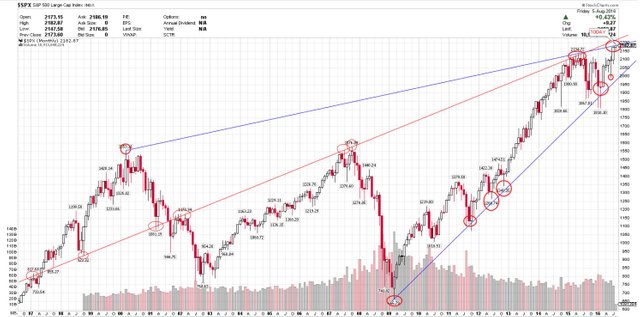
Congratulations @mikec! You have received a personal award!
Click on the badge to view your Board of Honor.
Do not miss the last post from @steemitboard:
SteemitBoard World Cup Contest - The results, the winners and the prizes
Congratulations @mikec! You received a personal award!
You can view your badges on your Steem Board and compare to others on the Steem Ranking
Vote for @Steemitboard as a witness to get one more award and increased upvotes!