TIB: Today I Bought (and Sold) - An Investors Journal #296 - Cloud Computing, Electricity, Interest Rates
Markets are rattled despite good US economic data. I do mimic a mystery $10 million yield trader - small scale but the same idea. Rates are going to rise as the US economy grows. Other trade action is in electricity and the cloud. Bitcoin and Ethereum seem to be diverging - it is a rocky road.

Portfolio News
Market Jitters - Tariff Tantrum Markets focused in on tariffs and slammed semiconductor stocks especially.

The real data for the week explains the headlines. Jobs data was better than expected. Manufacturing and Services PMI's were at records. The US economy continues to move ahead while the rest of the world seems to be in a muddle (Europe especially). And there was no tariffs announcement on Friday - just as I expected. Maybe we will have to wait for the two rallies that Donald Trump is attending on Thursday and Friday this week. No Canada deal too - did not help the mood.
What did move was Treasury yields
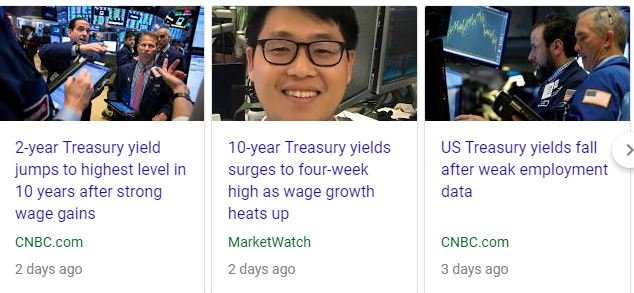
Of course that depends on which analysts you listen to or which headline you read. This is flip flop world. Fear drops yields. Data drives yields. The clue in understanding the headlines is the timing - the headline talking about yields slipping is about the ADP jobs data released on Thursday and not the government non-farm payrolls data released on Friday.
Biggest surprise in my portfolios has been creeping along all week - about the only things going up consistently = Indonesia and Italy. That tells me there are some bargain seekers who are not overtaken by fear.
The talking heads were talking on Monday about a mystery trader who made a $10 million punt on Treasury yields ahead of the jobs report. He got it right - I feel pretty good too as it is exactly what I did too.
Bought
Workday, Inc (WDAY): Cloud Computing: Financial and working capital services. As indicated in TIB294, I averaged down my entry price on this stock after their earnings announcement disappointed markets the day I bought my first tranche.
Sold
Electricite de France (EDF.PA): French Utility. Price has been holding above €14 for some time. I added a take profit target on June 2019 strike 12 call options in one of my other portfolios after the prior day sale. This was hit for a 145% profit since May 2018. I did review out-the-money call options - options are listed further out in time but there is low liquidity. I am holding December 2019 strike 14 call options in one portfolio. I am not convinced price can get to €16 and beyond.
Shorts
I had a strong feeling about the data driving the US economy and expected a good jobs report. I took action to switch resources from Swiss shorts to Europe and US. My analysis of the week tells me that the Swiss National Bank is simply not going to budge and will fight the market to keep rates low and steady. They win. The trade needs more time than I can get in my IG Markets account. I will fight somewhere else. See TIB292 and TIB295 for a discussion on global interest rates and Switzerland.
Euroswiss 3 Month Interest Rate Futures (S): Closed one short contract for 3 basis points loss (SFr 75) - these contracts expire next week. I do not want to roll them over.
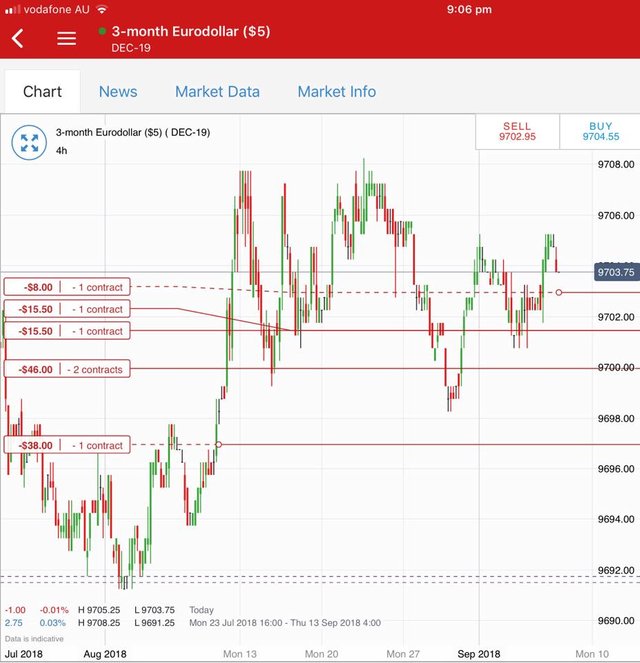
Eurodollar 3 Month Interest Rate Futures (GEZ): Opened up one new December 2019 contract short. Here is the chart directly after I made the trade. The trade shows classic reversal trading with price move up to level the previous high and then trading lower to take out prior two bars lows. Because of spread my entry is well below those previous lows. I could have set up a pending order to be a bit higher including the spread. Note: this is a price chart. Price falls when rates rise. I want it to fall.
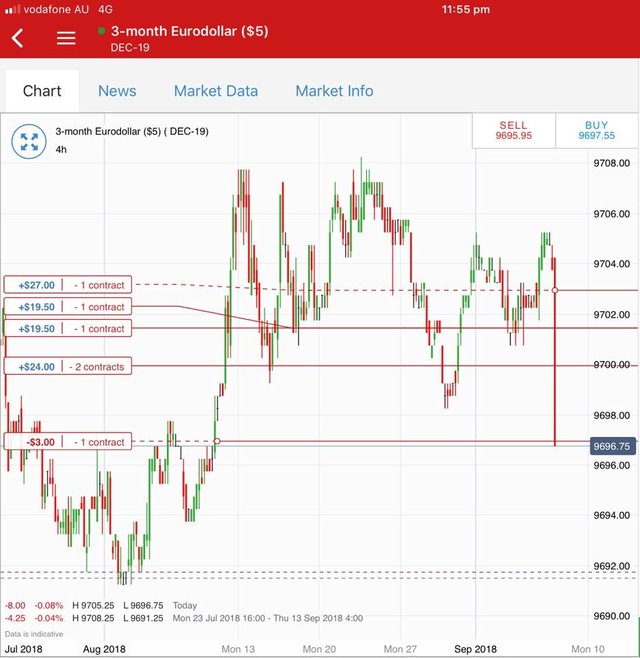
This is the chart directly after the jobs report was released. My trade was not a $10 million trade but it did convert a bunch of trades from red to blue (open contracts shown on the left). What I like about the chart is it made a lower low (4 hour chart) which confirms the downtrend is back in place.
Euribor 3 Month Interest Rate Futures (IZ): Opened up one new December 2020 contract short.
Cryptocurency
Bitcoin (BTCUSD): Price range for the weekend was $431 (6.6% of the high). After the vigorous price action down on Sept 5 and 6, price took a breather on Friday forming an inside bar. The downward momentum continued on Saturday - weekends are commonly down times. Price recovered to form what look like train tracks (again).
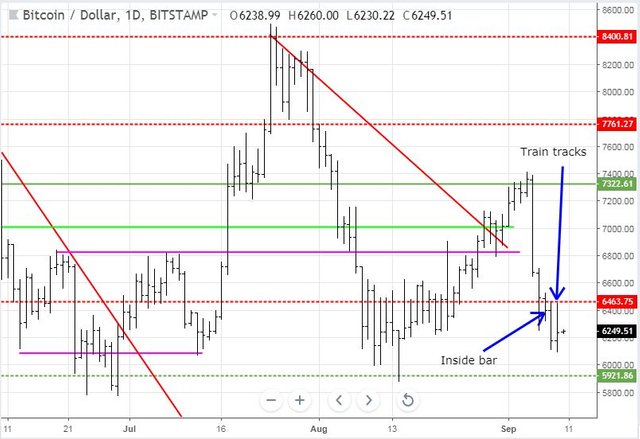
These are not the best looking train tracks as the day's close was below the half way mark on the price bar - this tells me that there were sellers abounding at the end of the day session. Price is holding below the resistance level around $6400. This is not a convincing level for me - looks like a messy zone.
Ethereum (ETHUSD): Price range for the weekend was $49 (20.9% of the high). Ethereum is proving to be the real problem child with volatility 3 times higher than Bitcoin. There is no doubt that ICO operators are dumping the Ether raised in their ICO's. When Vitalik Buderim, Ethereum founder says the glory days are over - they are over (or he has sold his ETH for something else).
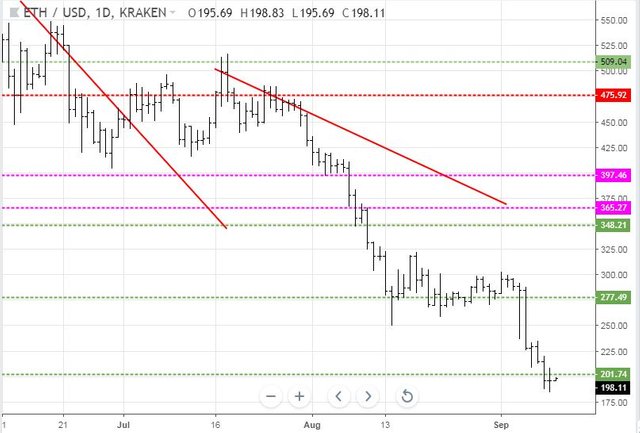
The chart tells the story - no train tracks here after trying to break up on Friday - just lower lows.
CryptoBots
Outsourced Bot One closed trade on PPT (2.59%) replaced with a trade on DGD now also a problem child (-11%). (221 closed trades). Problem children stayed at 18 coins. (>10% down) - ETH (-69%), ZEC (-63%), DASH (-57%), LTC (-48%), BTS (-51%), ICX (-79%), ADA (-69%), PPT (-77%), DGD (-81%), GAS (-80%), SNT (-61%), STRAT (-74%), NEO (-78%), ETC (-50%), QTUM (-78%), BTG (-72%), XMR (-38%), OMG (-66%).
DASH (-57%) was one of a few improvers going up a level. DGD (-81%), GAS (-80%), SNT (-61%), and ETC (-50%) all went down a level and DGD remains the worst. Too bad it was on the list of coins open to buy on the one bot that is trading. I will remove it from that list.
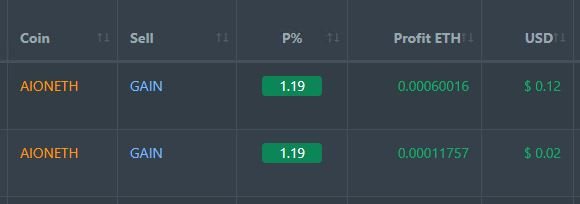
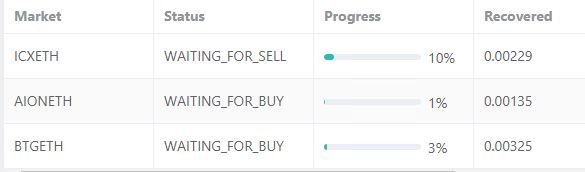
Profit Trailer Bot Two closed trades on AION (1.19% profit) bringing the position on the account to 1.97% profit (was 1.95%) (not accounting for open trades).
There are no coins on the Dollar Cost Average (DCA) list.
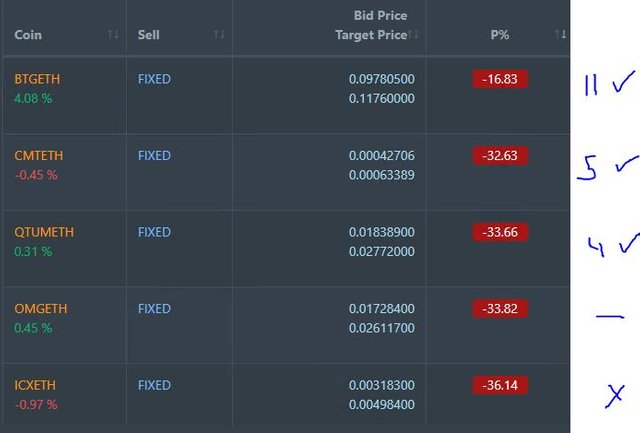
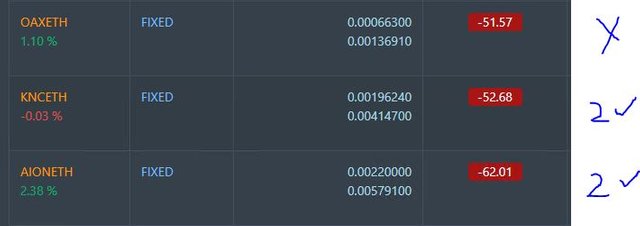
Pending list drops to 8 coins with IOTA trading out to profit. 5 coins improving, 1 coin trading flat and 2 worse. BTG had a big day moving up 11 points.
PT Defender completed the defence of IOTA for a profit of 1.69%. It did leave dust behind which I converted to Binance Coin (BNB) which is used to pay trading fees. That leaves 3 coins being defended. I will add another coin to defence - this time I will choose one with a small holding (CMT).
Dust: parcel size that is smaller than minimum, trade size. Binance has a neat facility to convert dust to Binance Coin (converted at market price with normal spread)
New Trading Bot Trading out using Crypto Prophecy (CP). LINK trade closed out in two tranches at 1.47% and 3.73%. I set up the trade because of the way price spiked on selling volume. The extent of that spike gave me confidence that the trade could run beyond the quick 1.5% (X1). 2nd target (X2) was hit 2 hours after trade set up.
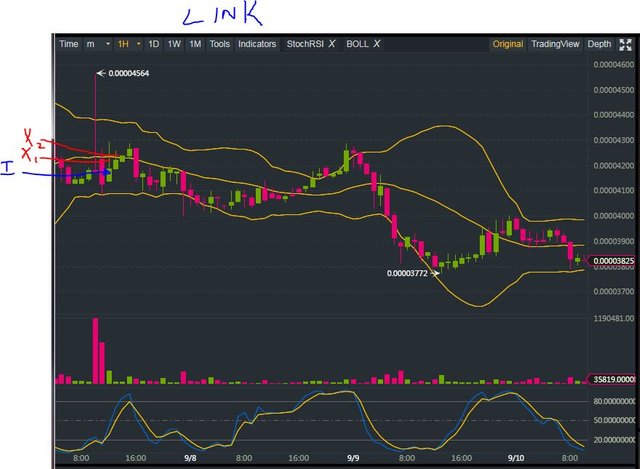
The journey after reminds me to skip the two tranche idea as a strategy - price spent a long time below entry price before making another run up .
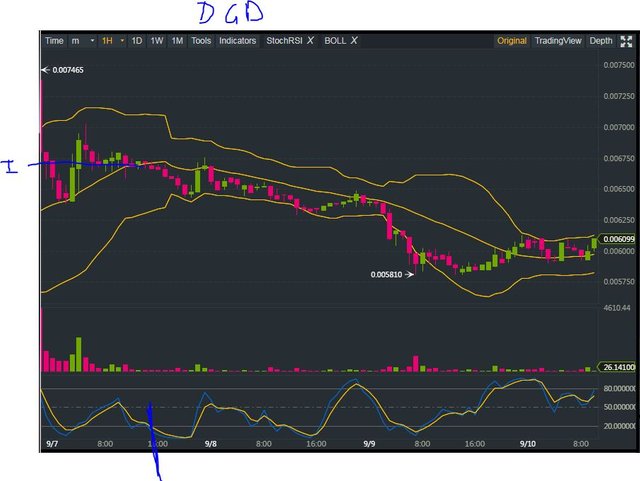
New trades entered on DGD and SNT based on Crypto Propehcy signals. These add to open trades on POA and TRX. Time to hold off until some of these close. Two charts to explore the strategy ideas a little further
DGD trade was based solely on the CP signal with price in the middle of the Bollinger Bands. I was looking for a volume spike to push price towards the top of the bands. Maybe I was taken in by the momentum indicator (lower window) which did suggest a break up. Lesson learned - confirm the CP signal with Bollinger Band status.
SNT chart does combine the CP signal and Bollinger Band status. At the time Bitcoin price was recovering from the big spike down - that normally drags altcoins up. After a long period of sideways I was looking for a break up. The momentum indicator (ringed in lower window) gives the clue - it is still facing downwards.
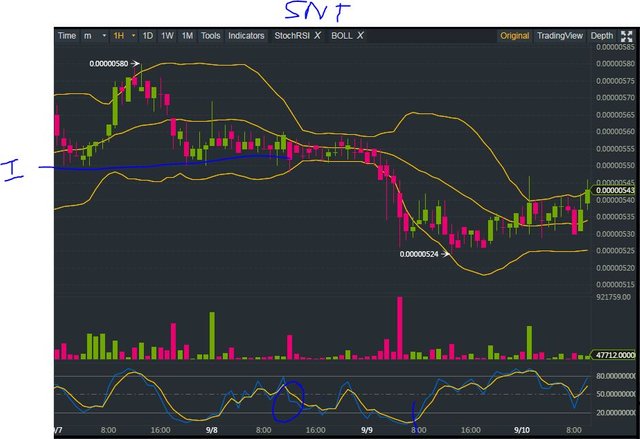
Smarter move is to wait for both indicators to cross into oversold and for them to reverse and fast signal (blue line) to pass through the slow signal from below (marked below where the 8:00 is). The good news is this can be programmed perfectly into a bot.
Currency Trades
Forex Robot did not close any trades and is trading at a negative equity level of 19.9% (way higher than prior day's 12.9%). Without looking at the trades I can see that this bot is leaning against the US Dollar. It looks really sad on strong dollar days.
Outsourced MAM account Actions to Wealth closed out 1 trade for 0.12% profits for the day.
Cautions: This is not financial advice. You need to consider your own financial position and take your own advice before you follow any of my ideas
Images: I own the rights to use and edit the Buy Sell image. News headlines come from Google Search. All other images are created using my various trading and charting platforms. They are all my own work
Tickers: I monitor my portfolios using Yahoo Finance. The ticker symbols used are Yahoo Finance tickers
Crypto Prophecy provides a useful tool to identify oversold and overbought coins - https://mymark.mx/CryptoProphecy
September 7, 2018
Ethereum is really looking bad and I think is what is leading the crypto market lower as bitcoin continues to hold on to the $6,000 level but eveb that is concerning as it may be a matter of time that breaks down lower. I am surprised to see these assets trade down despite the increased risk appetite in the capital markets; wouls have thought investors would have rotated back in after the declines seen and stock matket recoveries.
My instinct is that there is not a great overlap between stock market investors and crypto investors, certainly not in value terms. It is what attracted me to crypto over 3 years ago - lack of correlations when I ran the data then.
With the big declines in crypto markets, there is not a lot of money going the other way either.
Great post. I love seeing an investor analyzing the markets and economy THEN ACTING ON IT.
Thanks. That is my aim - walk the talk