TIB: Today I Bought (and Sold) - An Investors Journal #291 - Turkey, Greece, Airlines, Video Gaming, Japan Govt Bonds
Tariff tantrum erupts again. I swap Turkey for Greece. Retracement trades in video gaming and US airlines. Japan interest rates rise and hits a profit target. Argentina looks for more help.
Portfolio News
Market Jitters - Tariff Tantrum Trump comes back to the tariff tantrum agenda and spooks markets again
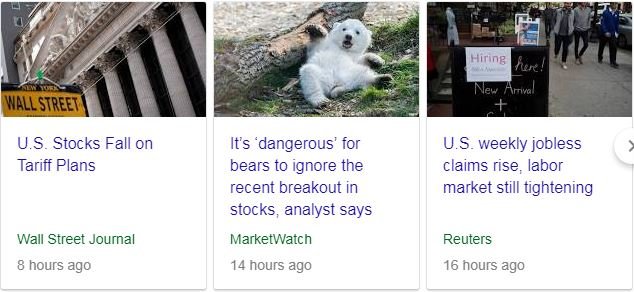
Markets price in all the information that they know about. One would think that they had priced in the $200 billion worth of US-China tariffs. The consultation period ends on September 6. Maybe they are hoping it will go away especially ahead of the midterm elections. All I can add is I have watched Donald Trump keep coming back to his agenda items. He started again talking about Europe after they offered a zero tariff deal on autos. He was talking about regulations and standards - "they have regulations that are different to ours which makes it impossible for US to export to Europe - e.g., in medical equipment". Welcome to Europe Muddles - a bureaucracy full of regulation makers that obfuscate and complicate standards to protect German and French jobs. They have been doing this ever since the European Union started and have over 50 years of practice.
The challenge is working out what to do about the upcoming rounds of the tariffs battle. One of the talking heads was talking today about this today - not smart to be in cash because there is still a lot of headroom in markets. When the tariff story settles or finds a path, stocks will rocket hard. Equally one does not want to be too heavily invested passively, e.g., in ETF's, because they fall hard when the herd changes direction. There is solid evidence in recent times on Turkey and Argentina. It is a stock pickers market is what I am hearing. Good to hear because that is what I have been doing progressively. The third headline gives a clue that this is right. The jobless market is getting tight - we will see wage growth - we will see increased consumer spending. My read is that this could be another 18 months of growth, more if Europe gets its act together
Argentina hits the skids again and raised interest rates to 60% to protect their currency. They ask the IMF to speed up the bailout funds.
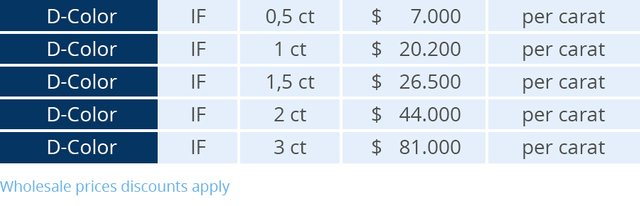
Merlin Diamonds Nice to get a news announcement a few days after I buy diamond miner, Merlin Diamonds about them finding some big diamonds - 9 and 18 carats.

http://www.merlindiamonds.com.au/resources/i/ASX-announcement---Diamonds-August-2018.pdf
The investment thesis was exactly that - gem quality and large stones and increased production throughput. The table shows the importance of size within a particular category - 6 times in size flows through to nearly 12 times in price. AND the Merlin discoveries are off the top of this scale
http://diamondworld.be/diamonds-cost-per-carat-education
Bought
Lyxor ETF Athex 20 (GRE.PA): Greek Index. A post about Greece by @deathcross prompted me to review investing in Greece. I am always keen to invest in situations that the market hates and where there is a chance of recovery. Greece just passed the 3 year anniversary of its last bailout. The share prices of Greek ETF's have been showing signs of life off the 2016 lows. Three charts to tell the story of my investing and why I added to one of my portfolios.
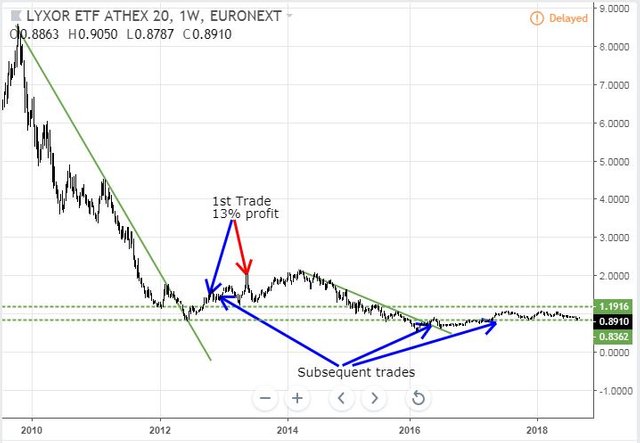
This chart shows the long run performance of the Greek ETF I bought, listed in Paris and priced in Euros - so no currency risk. It shows also my trade story in one portfolio. One profitable trade and 3 small open positions one of which is profitable. It also shows price climbing off the lows and making higher lows.
In TIB290, I wrote about selling down some of my Europe index holdings and switching to specific country or company stocks. This next chart comes from that thinking. It compares a Euro Stoxx 50 ETF (MEUD.PA - black bars) with the Greek ETF (orange line) over the last 12 months. Greece has outperformed Europe quite a lot of that time and when it outperforms it really moves. The gap opens up to 25 percentage points each time and then slides back with each market crisis.
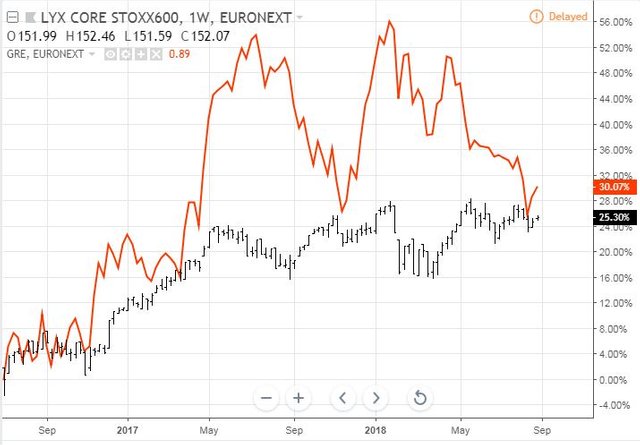
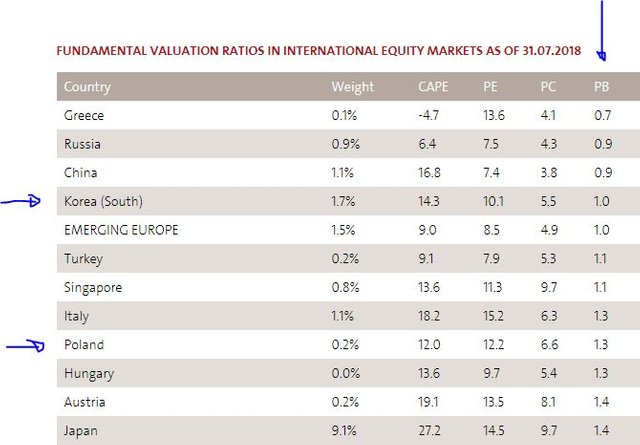
This reminded me to go back to the next picture which is a table of relative market valuations measured by Price to Book Valuation by country which I shared in TIB282. Greece is the lowest valuation market worldwide. With the austerity program working and the economy improving this has to change in the long term.
https://www.starcapital.de/en/research/stock-market-valuation/
I did make two transactions. One was a straight investment. The other was to invest the proceeds of dumping half my stake in Turkey. The age old Turkey - Greece rivalry continues in my portfolios.
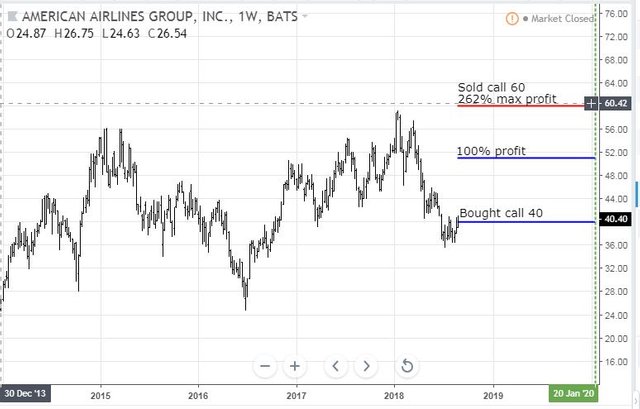
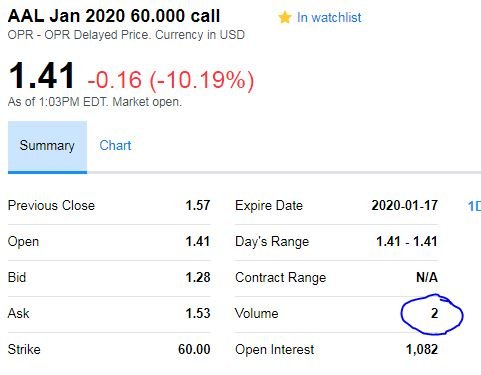
American Airlines Group Inc (AAL): US Airline. I ran my stock picking screens for all stocks. On a Price to Sales screen, two US airlines popped up - Delta (DAL) and American (AAL). I am holding January 2019 bull call spreads on Delta which are very close to maximum potential profit with closing price of $58.35 not far away from the sold leg of $60. The American chart looks promising with a strong pull back to a support zone and scope to run a bull call spread from current price to previous highs. I bought a January 2020 40/60 bull call spread for a net premium of $5.51 (13.6% of closing price) giving maximum profit potential of 262% if price passes $60 on or before expiry. With a $40.40 closing price, the spread is a little in-the-money. A 45/65 was looking to difficult as I am not convinced price will clear $60. Let's look at the chart which shows the bought call (40) and 100% profit as blue rays and the sold call (60) as a red ray with the expiry date the dotted green line on the right margin
All price has to do is get back to 2018 highs and the trade will make maximum profit. Now if I overlay Delta Airlines (DAL - orange line) we can see that whatever happened during 2018 was specific to American Airlines and was not an industry wide problem.
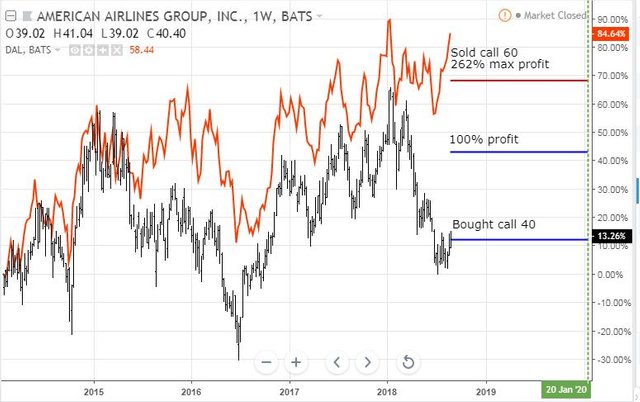
It is now up to American management to fix the problems. Best part also is I have profits in hand from Delta to fund the trade. On the options chains I was not the only buyer of the 40 calls but I was the only seller of the 60 calls. Someone is hoping price will clear $60 plus the premium he paid - if not I get to keep the premium.
Electronic Arts Inc (EA): Video Gaming. EA announced earnings just prior to market open. Two key parts of the earnings announcement rattled investors - foreign exchange effects of the strong US Dollar and delay of the launch of one of their games. The market did not like that and smashed the stock down 12% to add to the recent declines. I bought a small parcel because I see gaming and eSports as a key growth area - and I have only been poking at the edges of it. Each time I have had a look at EA I have decided it was too expensive. Looks like I may have just scored a 25% discount.
I did not check the charts when I made the trade but I did have a feel for what I would see - something like the Caterpillar chart I shared yesterday. Price making a strong move up and then retracing to the weekly uptrend line. Call it instinct or call it experience but that is exactly what the chart looks like. I have plotted just over 5 years and drawn in each weekly uptrend line as the trend has steepened every two years or so. Price has just come back to the most recent uptrend line.
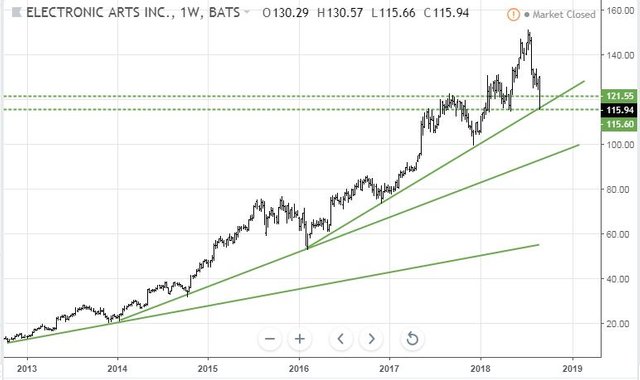
There is a lot of technical risk in the trade. Price has broken below a key resistance line (top green dotted line which coincides with a 0.768 Fibonacci level). It has also dropped down to the lows from the last cycle up (the lower dotted green line) which coincides with the uptrend line. If price breaks below this level it is heading to the next support level which is around $100 or another 15% down.
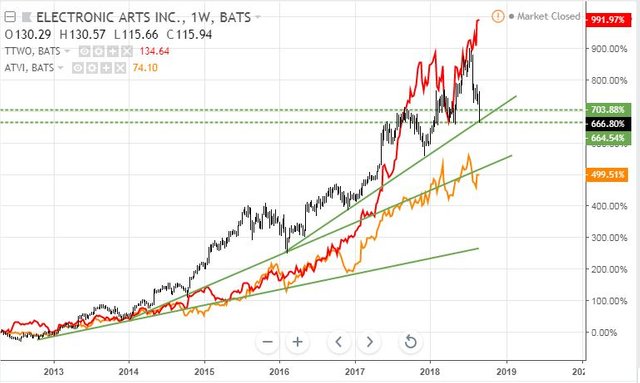
I watched the talking heads at the end of the trading day. They have been talking up EA for quite some time on the back of the gaming and eSports growth. This morning they were all saying they would not be entering at this level as they fear there may be more bad news to come and the chart has some technical challenges. Maybe I would have been better waiting for that information. I am going to add one more chart. EA competes with two other key players (in US), Take Two Interactive (TTWO) and Activision Blizzard (ATVI). I have added them to the chart. TTWO (red line) has not seen a correction and is now 290% points ahead of EA. ATVI is lagging but it has seen a smaller correction (17%). This sector is high growth and TTWO chart tells me there could be more as eSports takes off.
Sold
iShares MSCI Turkey ETF (TUR): Turkey Index. I bought into Turkey two years ago on the back of solid economic growth. The trade was looking solid until the middle of 2017. It is one of the world's fastest growing economies and has a young population - so that will continue. What I did not count on was the way President Erdogan was driving growth and how he would respond to the Turkish Lira crisis. Basically he was priming the pump long after he needed to and he was weak in taking action to defend the Turkish Lira.
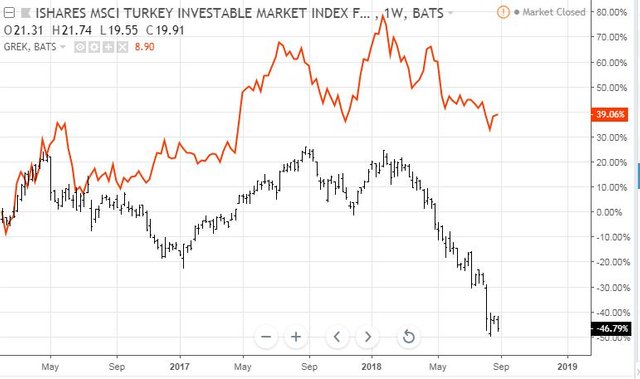
The talking heads are all saying that the problems in Turkey are now deep rooted and there is no recovery in sight for a very long time. I sold half my holding for a 51% loss since July 2016 and switched it to Greece. At least prices were up off the lows from 3 weeks ago. The chart shows two US listed ETF's since the 2016 lows for Greece (which is when I started in Turkey). If Greece can get back to its highs, I will recover half of the Turkey losses.
Shorts
Japanese 10 Year Government Bonds (JGB): Japanese yields rose during the day following Europe and US and one open contract hit a take profit target with a price spike lower for 26 basis points profit (0.17%). Contracts are ¥1 million. I have put in a new pending order to sell again if price moves back to 15050.
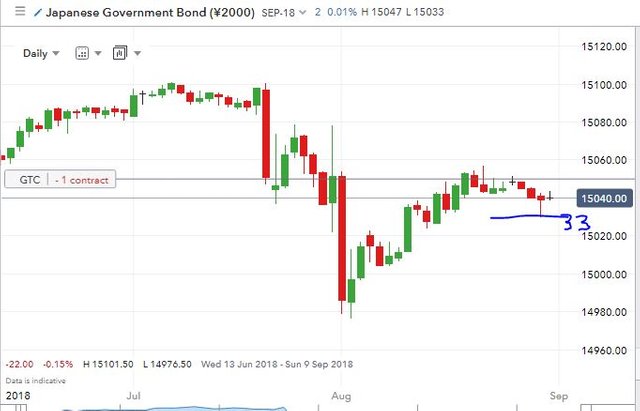
This leaves me with no open contracts - it has been quite while since that happened.
Cryptocurency
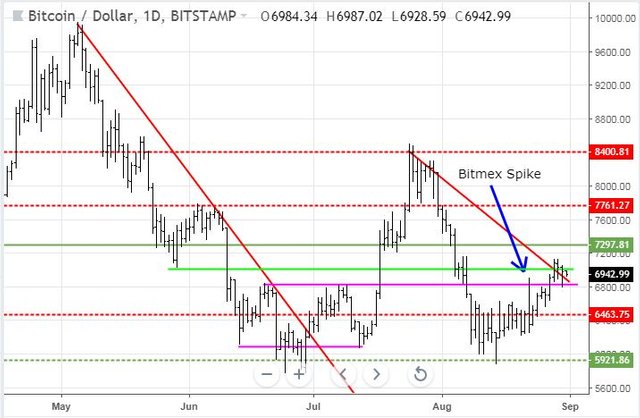
Bitcoin (BTCUSD): Price range for the day was $263 (3.7% of the high). Price just did not want to break higher and was drifting down most of the day. It did find support (on the newly drawn line (upper pink ray)) and returned close to where it opened the day. I get a feeling that there are a lot of new participants here relying on recent technical history for turning points. These intermediate support lines are becoming important.
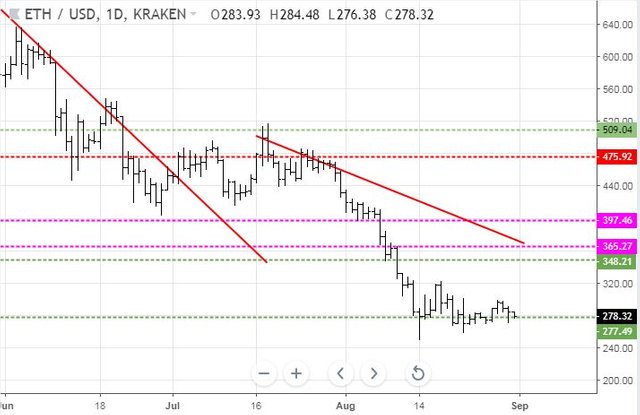
Ethereum (ETHUSD): Price range for the day was $21 (7.2% of the high). Price action looked a lot like Bitcoin but with twice the volatility. The encouraging part is price went back to test the support level around $275 and held it.
CryptoBots
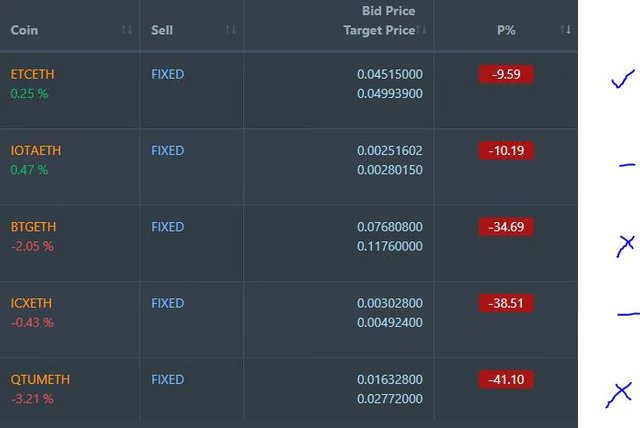
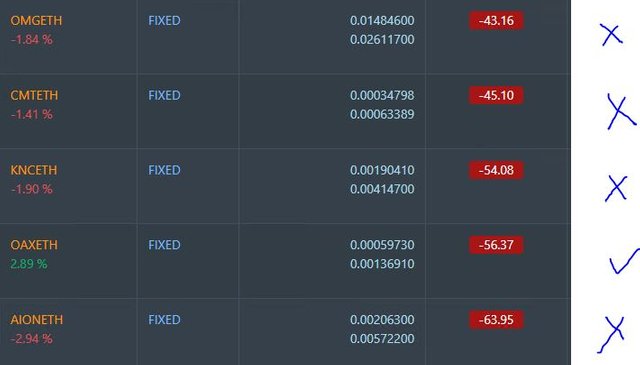
Outsourced Bot No closed trades. ZEC trade did not as I was hoping it would. (218 closed trades). Problem children stayed at 18 coins. (>10% down) - ETH (-61%), ZEC (-59%), DASH (-65%), LTC (-49%), BTS (-49%), ICX (-74%), ADA (-64%), PPT (-76%), DGD (-77%), GAS (-81%), SNT (-58%), STRAT (-75%), NEO (-79%), ETC (-49%), QTUM (-75%), BTG (-21%), XMR (-45%), OMG (-63%).
All coins dropped a point or two apart from XMR. GAS (-81%) remains the worst coin.
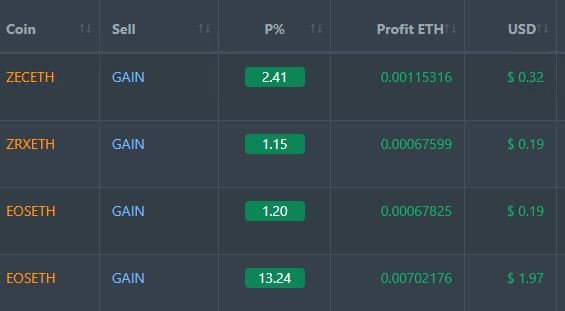
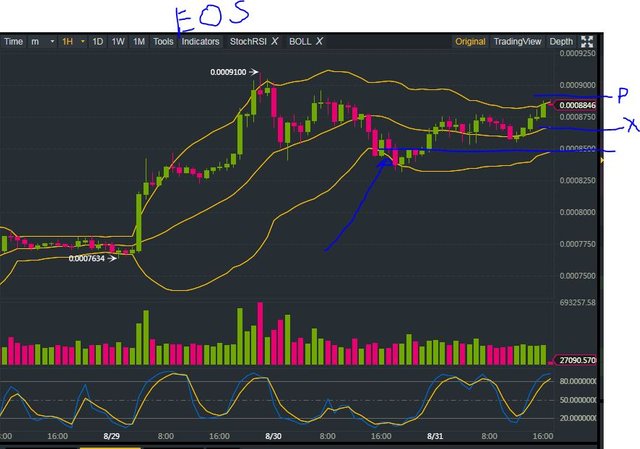
Profit Trailer Bot Four closed trades (4.5% profit) bringing the position on the account to 1.75% profit (was 1.538%) (not accounting for open trades). EOS was the standout coin for the day with two wins and one that trailed up to a 13% win.
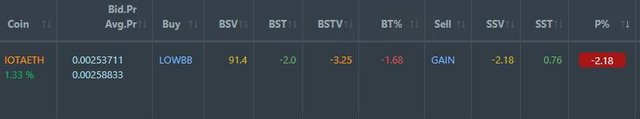
IOTA stayed on the Dollar Cost Average (DCA) list but did move up a few points. The DCA changes to buy on Low Bollinger Bands does not appear to be working. The setting is to start trailing 2% below the band and the current position is 3.25% below. Not sure what is happening there but I am OK not to buy more. PT Defender effectively runs a DCA program as it defends by buying.
Pending list remains at 10 coins with 2 coins improving, 2 coins trading flat and 6 worse.
PT Defender is still working on 3 coins and made no progress. It is waiting for IOTA to sell.
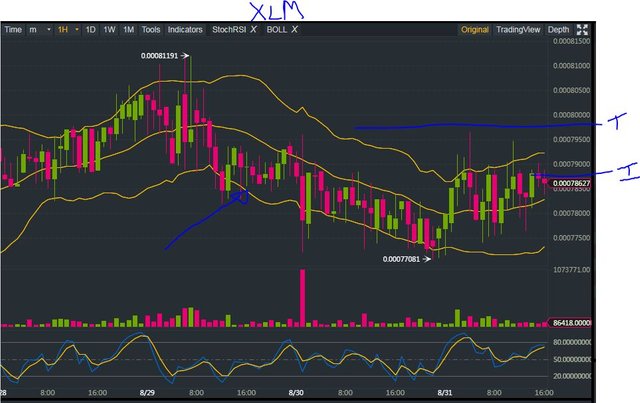
New Trading Bot Trading out using Crypto Prophecy. As indicated in TIB290, I have 4 outstanding trades that are under water (LINK, XLM, RCN, GTO). XLM has moved back into an uptrened on an hourly chart. I have closed half just above breakeven and will let the other half sit at the original 1.3% target. The chart shows that price did move off the lower band but did not quite reach the target at the first or second attempt (top blue line).
As I have taken half off for each of the other 3 trades I will let them run.
I did test out a different screen on an EOSBTC trade. The screen makes sure that price is in an uptrend (10 day moving average is above 20 day moving average). I took off half at 1.3% and have now to decide when to exit with current position at +3.5%. I would really like the option of running a trailing stop to see how far this can run. I have put in a pending order above the market to sell another half and will let the last part run.
Currency Trades
Forex Robot closed 8 trades (0.31% profit) and is trading at a negative equity level of 14.9% (higher than prior day's 14.2%).
Outsourced MAM account Actions to Wealth closed out 4 trades for 0.37% profits for the day. They have 2 open trades short the New Zealand Dollar.
Cautions: This is not financial advice. You need to consider your own financial position and take your own advice before you follow any of my ideas
Images: I own the rights to use and edit the Buy Sell image. News headlines come from Google Search. Price Book screen and Diamond related images are credited below the images. Argentine flag is not subject to copyright. All other images are created using my various trading and charting platforms. They are all my own work
Tickers: I monitor my portfolios using Yahoo Finance. The ticker symbols used are Yahoo Finance tickers
Charts: http://mymark.mx/TradingView - this is a free charting package. I have a Pro subscription to get access to real time forex prices
Crypto Trading: get 6 months free trades with Bitmex for leveraged crypto trading.
Crypto Prophecy provides a useful tool to identify oversold and overbought coins - https://mymark.mx/CryptoProphecy
August 30, 2018
I don't know if Greece will outperform now, debt is still very high and it can be hit again in case of an emerging market selloff. Or a new European debt crisis, or a refugees wave.
May be those could be the right time to buy.
What the charts tell me is that in the last 12 months Greece has not under-performed a European index. Yes it has been a whole lot more volatile.
What the Price to Book Valuation table tells me is the book values are low. If they have taken enough action to write down the book values, there is potential for stock values to rise. There is a 42% gap in valuation to Emerging Europe and more to Turkey. Close half that gap and there is a 20% stock advance.
Is all the bad news is already in the price? Is most of the bad news in the price? Can it get any worse? How much worse can it go? That is the step of belief in making the trade.
https://www.starcapital.de/en/research/stock-market-valuation/
Now Turkey is a different situation. Yes it has a PB of 1.1. It can go down to where Emerging Europe is or worse to where Greece is.
Great look at the video game space as I also continue to see a lot of potential for growth in eSports. However, most of the publicly traded companies have also been challenges with the new Battle Royale genre that the game Fortnite has popularized. Now these large publishers are chasing them with their own versions in their yearly franchises. It will be interesting to see if they succeed!
Disney/ESPN might be a good backdoor with some other aspects to mitigate the risk. Like all my plays I have things spread around a bit.
This post was upvoted and resteemed by @resteemr!
Thank you for using @resteemr.
@resteemr is a low price resteem service.
Check what @resteemr can do for you. Introduction of resteemr.