How to use the indicator cloud Ichimoku, the crypto currency trade
 Today, let us talk about business with the Echimoku cloud, and consider its skills and considerations.This indicator can very well determine the level of support and resistance, setting the trend direction. He was invented by journalist and financial analyst Giochi Hesoda and introduced to the public in 1969. At first glance, the index seems to be complex and confusing, but its practical application is quite simple and useful.
THE INDICATOR VOLUME, HOW THE CRYPTO CURRENCY FORECAST IS PREDICTED
Ichimoku cloud, details
Let's talk a little about its index and its material theory.
Ichimoku index consists of 5 lines:
- Tenkan-Sen shows the average value of the price for the first time, this period is defined as the maximum and minimum sum, divided by two;
- Kijun-Sen sees the average price of the price for the second time;
- Senco span A shows the intermediate distance between the previous two lines, moving forward by the second-row interval;
- SENCO SPAN B does show the average price for the third-time interval by the price of the third time difference.
- Chinky span shows the current Japanese candle closing time, the second time the transit shifted back by quantity.
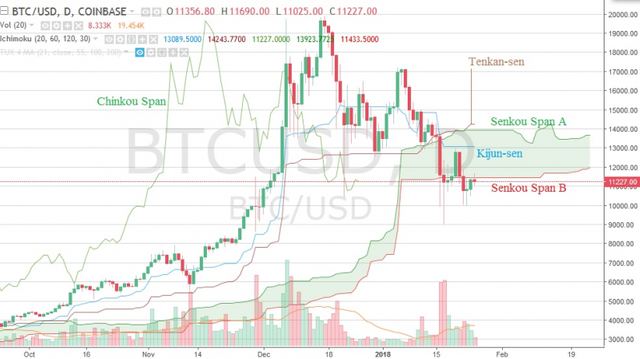 Ichimoku cloud, main lineThe distance between the Senku lines is the Ichimoku cloud.

Ichimoku cloud, how to use it on the trade
If these lines have a price, then the market is equal to non-trendy and cloud edge then support level and resistance level. This case is well suited for marginal or other trade. That is, you can trade both inside the lengthy and shorter clouds, but do not forget about stop orders
MARGIN TRADING ON STOCK EXCHANGES, HOW THE CURRENCY SHORTCUT
If the price is above the Isimmoku Cloud, its upper line respectively form the second support level and the second line form the first support level. That, from the top line you can count on (always!) Long (rebound), just remember about the stop, because there is a breakdown in the market.
THE PSYCHOLOGY OF TRADING, HOW DOES A PANIC KEEP YOUR SUBMISSION?
Let us see an example of using the Ichimoku cloud in crypto-currency market.
 Ichimoku Cloud, is an example of using the indicatorResistance levels were $ 13100, Coinbase Chart, 1D. Wind tried to emanate the clouds, but they did not work for the first time. The maximum minimum reached 12800 $.What can you do in such situations?
TO BE LONG-TERM IN MARGIN TRADING , YOU CAN KEEP THE WARRANT / STAIRS UP TO $ 1,300-1,200,000.
ORDER OFF 12300-12350 $ (CONSIDERABLE LOSSES ON THE TRADE, THE LEVEL OF $ 12000 OR USD 12550 CAN SUIT YOU).
TAKE ADVANTAGE - AVERAGE ENTRY PRICE (WHICH WILL BE A NORMAL SEQUENCE AFTER YOUR PURCHASE) IS A 500 $ RISING MINIMUM PLYUSETE!
Suppose you went to 10 contracts (bitmax) with a leverage of bitmax exchange (10000x). The average value is 12900 $ the order quantity is 0,7752 BTC. Should be 0,1352 BTC on the shoulder with 10x. You will get Exxtx BTCC for sale at $ 13400. At the same time, note that the price of the chart has increased by $ 0,0289!
TRADE IN TECHNICAL ANALYSIS STATISTICS, HOW TO FIND ENTRY POINTS
If you do not use margin trading, then you can buy a coin from this level and sell it with a margin of $ 500.
LONG REPETITION YOU CAN TRY FROM THE SECOND SUPPORT LEVEL - $ 11400 (WHEN THE PRICE AGAIN COMES BACK TO CLOUD ICHIMOKU, THE SCREENSHOT BELOW).
NOTE PURCHASE OF $ 500 PLUS
DO NOT FORGET ABOUT STOP-HOLA ORDER SUPPORT LEVEL AT $ 200-300Cloud Ichimoku, long from $ 11400If the price is below the Ishimoku cloud, the first level of resistance is created at the upper end of the line - the second is the resistance level (see the next screen). That, there are two big resistance levels for the current situation:

- 11400 $ (which is repeatedly divided by bulls, but it still has no clear specifications);
- $ 13,925 (a strong level of resistance for the upcoming days, its penetration bulls will be able to express the trend)
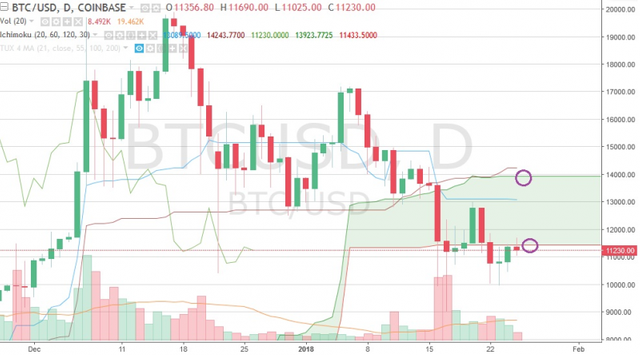 Ichimoku cloud, two levels of resistanceIf the Chinkou Span exceeds the price list from the bottom of the line, it is a signal to buy. If from the top - sales of a signal.The example just shows that after 5-6 January, Bitcoin needs to be sold / shortened. See the following screenshot: Purple Circle - Chinkou span exceeds the price line, the green - its value in the chart.

A VERY IMPORTANT POINT:CHINKOU SPAN SEEMS TO BE A BACK SCHEDULE. IN FACT, THE CURRENT LINE OF THE CHART FOR THIS LINE FACILITY HAS BEEN TAKEN SLIGHTLY SLIGHTLY.Chinkoo span exceeds the price lineThe main line of the Kijun-Sen (blue line) is considered and used as an indicator of market movement.If the price is higher than the price, the price could probably increase. When price surpasses this line, it is likely to change the trend further.

THE BEST STRATEGY FOR INVESTING AND HOW THE BBC EXAMPLE IS BEING CORRECTED BY BITCOIN'S EXAMPLE
Another option to send a signal is to send Kijun-Sen. Tenken-sen (brown) line spreads from below the Kizun-Sen (blue) when a purchase signal is generated. From top to bottom - sales of a signal. This rule works better when compared to the Ichimoku cloud value.In an example with Bitcoin, the price is broken by the cloud, but it is clear that Tencan-Sen has crossed the Kizun-Sen out. This means that the local minimum for the current or the next (1-2 days), you can try / you can login. In this case, the rebound will be very strong. Tancan-Sen crossed the Kizun-Sen from BahurAnd it happened. The first price is available for $ 10000, the next day - $ 9000 then there was a $ 12400 maximum
HOW THE ALTCOYINS CORRECTED CORRECT COURSE, HOW TO MAKE MONEY
Tenken-Sen is considered to be a toring line and is used as an indicator of market trends. If this line increases or falls - the trend exists. When it goes horizontally - the market channel is inserted. The following example shows that the price is $ 13000-15000 in the larger channel. Cloud Ichimoku, channel $ 13000-15000 in the marketThis indicator works well in big timeframes: one week, one day, 12-6-4 hours. You can try working with it for 30 minutes-2 hours, but do not forget to apply additional articles, which we will discuss in our article "RSI, MACD, CCI, EMA, SMI Indicators, How to Use, Settings and Details" Have doneRead our resources and recommend it to your friends! All the profits!
If you follow ,upvote ,comment and resteem me I will do same
I enjoyed your take on the ichimoku cloud for cryptocurrency. I've got a similar approach. Many people do not double the settings but you do. That is a good thing since crypto is 24/7 unlike the stock market. I made a small ichimoku for beginners guide here. feel free to check it out.
Great post appreciate it. https://9blz.com/smi-indicator-explained/