Crypto Trading with Price Action - Crypto Academy / S6W2- Homework Post for @reminiscence01".
Explain your understanding of price action.
Price action is simply the movement of the price of an asset. Within the movement of price, so many things can be deduced by traders. The price can move upwards, it can move downwards, and it can move sidewards as well.
It is part of the core that makes up Technical Analysis. It is usually performed on trading charts. Price actions allow traders to spot past movements of price and patterns of the price which can be useful in predicting future movements
Apart from technical analysis, there are other methods of analysis that can be used to determine the future movement of price. The notable methods are Fundamental Analysis and Sentimental Analysis. The main problem with these methods of analysis is that the data necessary to perform analysis are not readily available and they also let people rely on the news. This can prove detrimental as the price must have moved at the time of the news, thus misleading people.
Technical analysis on the other hand is readily available on trading charts. As such people can simply go over to their trading charts to see firsthand what is going on in the markets. They can see the past price, the current price, the buying and selling pressures, and so much more information than the price action can give.
Along with the raw information that traders get when they log in to their trading charts, price action can also give subtle information such as the past and current trading emotions and the psychology of the market. This is because when price moves in a certain direction a lot of traders are in favor of that direction. Also, when the price reaches certain limits a lot of traders have become emotional at that point and such limits become a psychological level.
In trying to predict the future movement of price, price action is commonly used in conjunction with other technical analysis tools to enhance the predictions being made. Some of these tools are support and resistance levels, the use of candlestick charts, the patterns formed on the charts, and trading indicators such as Relative Strength Index, Moving Average, Bollinger Bands, etc.
Price action is very useful for traders as it gives them points of entries and exits in the markets, so they can develop a good trading plan with proper risk management using the information that is given.
What is the importance of price action? Will, you chose any other form of technical analysis apart from price action? Give reasons for your answer.
As we have seen previously, price action is very useful in so many ways. I shall discuss some of their importance.
It gives a clue on the sentiments of the market:
The market is an interaction of buyers and sellers. The price of an asset moves according to the emotions and psychology (sentiments) of the market. Through price action, one can know the present sentiment of the market, that is, what the buyers or sellers are doing at a given time. With this information, traders can know the direction of the market to follow.
Makes us see the patterns that the price has formed:
Price actions make different pattern formations on the charts. These pattern formations are directly related to the market structure. They are uptrend, downtrend, top and bottoms, flags, asymmetrical triangles, etc. Once such patterns are formed, traders can make better decisions on the next direction of the market.
Can be used in collaboration with other technical analysis tools:
Traders can use price action with other trading tools to enhance their trading performance. Some of the trading tools include support and resistance, market structures, RSI, Ichimoku Kinko Hyo, etc. As the price is moving traders can add another trading tool to get a better perspective of the movement of the price and better entry and exit points.
Removes noises and filters out false signals that other indicators give:
Other technical indicators can give false signals because they make use of past price data points. Using these other indicators with price action helps to filter these false signals because price actions reveal the current price of the market. So when a technical indicator is giving a signal, price action can confirm if the signal is true or false. It can also remove the noise that is usually experienced in ranging markets. If the market is ranging in a certain timeframe, a trader can check another timeframe and see that the price is no more in a range.
Shows the current trend of the market:
When the market is trending it usually moves in a particular direction. The best thing for any trader is to go along with the trend, if he does the opposite, then he can expect a very terrible situation. By following the price action, one can identify the current trend of the asset.
Helps to give points of entries and exits:
This is a very important aspect for all traders as it can make or mar a trader. Having good points of entry can make a trader profitable in the long run, likewise, having bad points of entry can make a trader lose their accounts and could even make them enter into depression. With the use of price action, traders can have better points of entry. It is also of note that good exits are also necessary for a successful trading operation, so having goods points of exits can also be done with price action.
Will, you chose any other form of technical analysis apart from price action?
Yes, I will choose another form of technical analysis. However, I wouldn't be using the other technical analysis as a standalone analysis method during trading operations because it can provide false signals. It can also bring about noises that can be confusing and misleading.
As a core principle of technical analysis, it is best for traders to make use of more than one technical analysis tool (usually 2-3). By following such principles, traders get to have better trading decisions, have trading methods that are effective, and also become profitable in the long run. Price action is not left out.
Therefore, I would be combining price action with other forms of technical analysis. This methodology would help me perform better in my trading operations.
Explain the Japanese candlestick chart and its importance in technical analysis. Would you prefer any other technical chart apart from the candlestick chart?
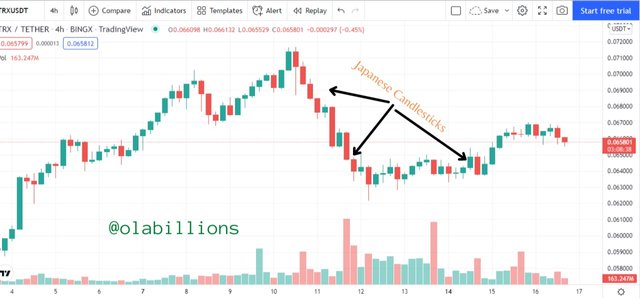
A Japanese candlestick is a charting tool that provides information about the price of an asset. It was developed by a Japanese rice merchant named Munehisa Homma in the 16th century.
In the markets, the price actions are a reflection of the buyers and sellers. Anytime the buyers are in control the price moves up, likewise, when the sellers are in control the price goes down. These upwards and downwards movements are presented by the Japanese candlesticks.
 Source: Tradingview
 It consists of the Open, High, Low, and Close. These four data points give information about the price actions. The open is the opening price of an asset, the high is the highest point the price reached for a given period, the low is the lowest point the price reached for a given period, and the close is the price at which the asset closed at for a given period.
When the candlestick closes higher than the open, the candlestick is bullish and when it closes lower than the open the candlestick is bearish. A series of bullish candlesticks show that the price is moving upwards and a series of bearish candlesticks show that the price is moving downwards.
The Japanese candlesticks can form patterns on the trading chart which conveys messages to traders. Some of the patterns are tops and bottoms, wedges, flags and pennants, triangles, etc. It can show the trend of the price. As the candlestick moves in a series of higher highs and higher lows, the price is in an uptrend, and if the price is in a downtrend, the candlestick will move in series of lower lows and lower highs
It can be used to identify levels of support and resistance. When the candlesticks reach a certain price level and bounce back, the level can be a support or resistance level, depending on the initial direction of the price. It can also show the buying and selling pressure on the price. When the candlestick goes up to the extent that it reaches its highest price point, it shows that there was a lot of buying pressures at that period, likewise, when the candlestick goes down to the extent that it reaches its lowest price point, it shows that there was a lot of selling pressures at that period.
We can also get candlestick patterns such as Doji Star, Hammer, Inverted Hammer, Bullish & Bearish Engulfing patterns. These candlestick patterns give signals based on market entries and the momentum of the trend.
Would you prefer any other technical chart apart from the candlestick chart?
Yes, I would prefer another technical chart asides from the Japanese candlestick trading chart. This is because even though the candlestick chart gives information about the price of an asset, they are usually a lot and can become overwhelming for traders. Also, a lot of noise is generated through the candlestick chart and this can make traders get confused when performing analysis on the candlestick chart.
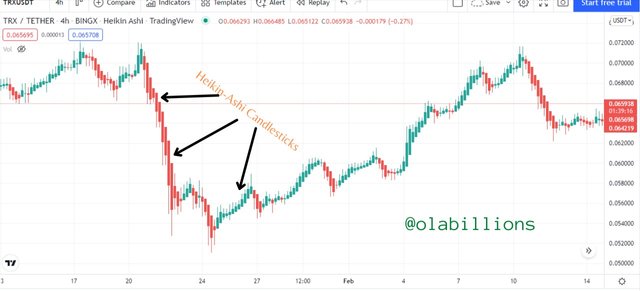
The chart I would prefer to use is the Heikin-Ashi trading chart. It is different from the Japanese candlestick because it makes use of different values in its calculation. Heikin-Ashi candlestick chart is also developed by Munehisa Homma in the 16th century.
 Source: Tradingview
 It provides less information than the Japanese candlesticks therefore it filters out the noise that is common in the Japanese candlesticks.
It has a smoother appearance than the Japanese candlestick chart. It doesn't show wicks at the bottom of the candlesticks to show that the price is in a strong bullish move or at the top of the candlestick to show that the price is in a strong bearish move. With it is easier to identify trends and trend reversal direction better than the Japanese candlestick charts.
What do you understand by multi-timeframe analysis? State the importance of multi-timeframe analysis.
A multi-timeframe analysis is a method of charting analysis that makes use of multiple timeframes to make an analysis of the price of an asset in order to get valuable information. Traders look at asset pairs in different timeframes in order to get clearer information on the current price. It plays a very crucial role for traders who employ this method.
With it traders can identify price setups of importance, areas of support & resistance on the chart, it can also give proper risk management. Traders can identify entries that give better results and also tighten the stop-loss being used.
The analysis can be done using higher timeframes like Weekly, Daily, and 4hr to spot the direction of the price, while lower timeframes such as 30 mins, 15 mins, 5 mins can be used for entries and to also get a tighter stop loss for the entry.
Making use of this type of charting analysis also depends on the type of trader and trading strategies being used. As such a "swing trader" would make use of timeframes such as monthly, weekly, and daily to get the direction of the trend and trade setups, then timeframes such as 4hrs, 1hr, and 30 mins would be used to get market entries and a tight stop-loss. A "scalper trader" would make use of timeframes such as 1hrs, 30 mins, and 15 mins for the direction of trend and timeframes such as 5mins, 1mins for entries, and tight stop-loss.
State the importance of multi-timeframe analysis
After looking at what multi-frame analysis can do we can see some of its importance.
Identifies Trends and Market Entries:
Multi-timeframe charting analysis can be used to identify the trend of the price and where to place an entry. A trader can use a chart of a higher timeframe to identify the direction of the price, then he can use a chart of a lower timeframe to get a better market entry.
It Filters out the Noise of the Markets:
By looking at a single timeframe, a lot of activities and information would be given out and this can be confusing at times. By employing multi-timeframe analysis, one can get a clue on the direction of the markets easily without having to worry about other unnecessary information. For instance, on a lower timeframe, the price can be ranging, but on a higher timeframe, the price can be in a downtrend.
Reduces the Risks and Tightens Stop-loss:
By using multi-timeframe analysis, risks for a trade can be reduced. For instance, when the direction of the price has been identified, he will go to a lower timeframe to place an entry. By doing so, the risks associated with the higher timeframe have been reduced, at the same time, the stop-loss placed at the lower timeframe would be tighter than if it was used in the higher timeframe.
It can be used to confirm price trends and direction:
As we have seen, we have to look at a higher timeframe to get a clearer view of the trend, we can then look at a lower timeframe to confirm the trend. Once we confirm the trend, it strengthens our conviction about the direction of the price.
With the aid of a crypto chart, explain how we can get a better entry position and tight stop loss using multi-timeframe analysis. You can use any timeframe of your choice.
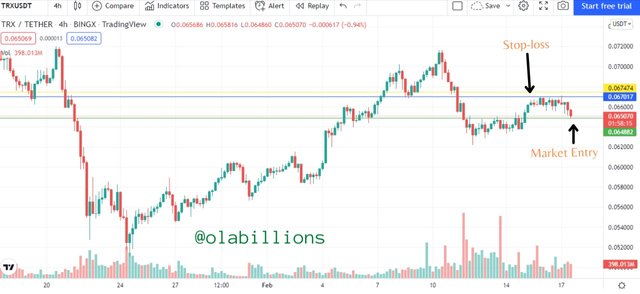
In this exercise, I would do a multi-timeframe analysis to get better entries and tight stop-loss. I would start my analysis with the 4hr chart of TRXUSDT.
 Source: Tradingview
 We can see some information about the movement of the price in the chart above. We can see that the price is moving in a downtrend. The first wave of the downtrend had occurred, then a retracement took place. It got to a level where the retracement wave couldn't move any further, so this level is the resistance level and is indicated with the blue horizontal line.
As the price hit resistance level it started moving back downwards. So a market entry is placed at the candle after the hammer candlestick and the stop-loss is placed just above the resistance level. The distance between the stop-loss level and the market entry is 0.002592 points.
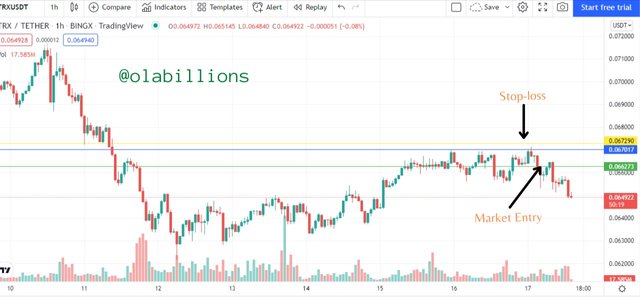
But when we go on to lower timeframes we can see that we would get better market entries and better stop-loss. Also, we can confirm that the direction of the price is downwards.
 Source: Tradingview
 This is a 1hr chart of the same cryptocurrency asset. We can see that we got a better price entry and the stop-loss became tighter. The distance between the stop-loss level and the market entry is 0.001017 points.
 Source: Tradingview
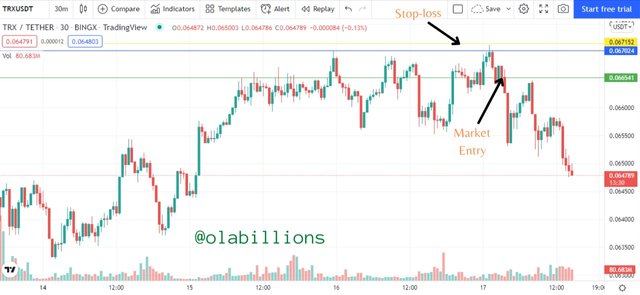
 Going lower, on the 30 mins chart of the same cryptocurrency asset we can see yet again that we got a better price entry and the stop-loss became tighter. The distance between the stop-loss level and the market entry is 0.000611 points.
 Source: Tradingview
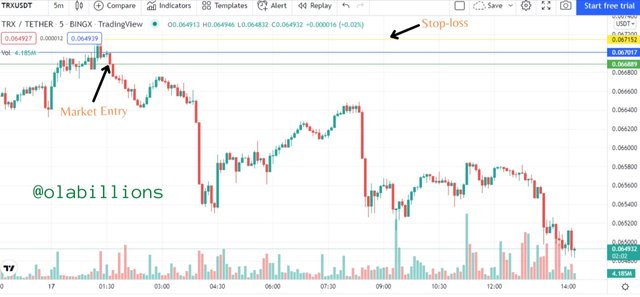
 Finally, on the 5 mins chart, we can see that if we had used the chart for our entry we would have gotten a better price entry with a tighter stop-loss. The distance between the stop-loss level and the market entry is 0.000263 points.
Carry out a multi-timeframe analysis on any crypto pair identifying support and resistance levels. Execute a buy or sell order using any demo account. (Explain your entry and exit strategies. Also, show proof of transaction).
For this exercise, I would be behaving like a "scalper trader", I would be using lower timeframes ranging from 2 hr to 5 mins.
 Source: Tradingview
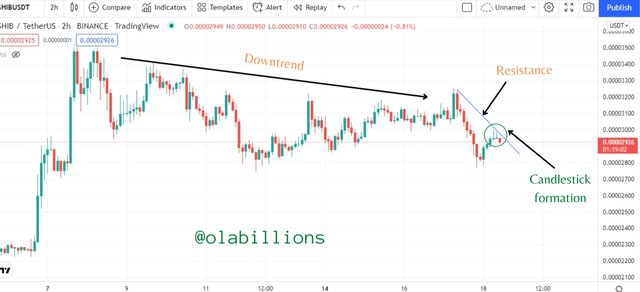
 The image above is a 2 hr chart of SHIBUSDT. The outlook of the market is that it was in a downtrend. However, there was a time when the downtrend became serious as it became very steep.
During the steep downtrend, the price moved in such a way that I was able to find a resistance point using the trendline. After the retracement of the first wave of the downtrend, two candlesticks gave an inverted hammer formation which signals that the retracement movement is over and a continuation of the downtrend to continue. This event also coincided with the touch of the trendline.
So I went to the lower charts to see what is happening and also place my market entry.
 Source: Tradingview
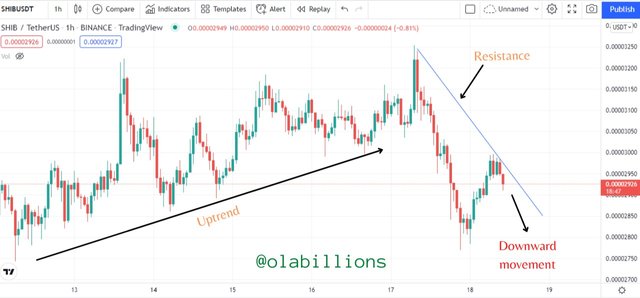
 The next chart is the 1 hr chart, on this chart the market was previously in an uptrend until it reached that point where the direction of the market changed.
It is at this point that the trendline is drawn to indicate the downtrend. The trendline also acted as a resistance level. We can see that the next direction of the price is downwards.
 Source: Tradingview
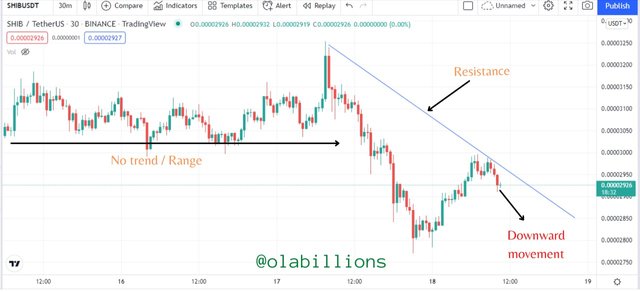
 Then I went to the 30 mins chart. On the chart, the price was previously in a range as it did not move in any direction but sideways.
Then it got to the point where the downtrend began. Also, a trendline was drawn to identify the downtrend and to show the resistance area. We can also see the direction of the price is downwards.
 Source: Tradingview
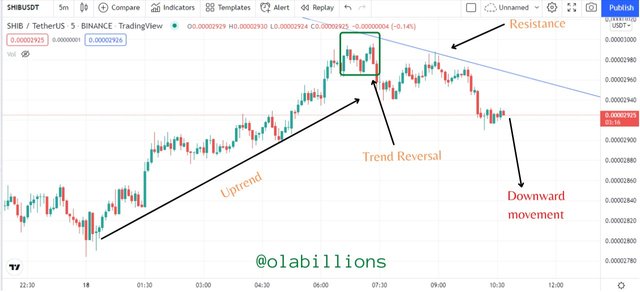
 The next chart is the 5 mins chart. On it the price was in an uptrend previously, then it gave a trend reversal pattern to show that the price is not going upwards any longer.
So the trendline that was drawn in the higher timeframes captured the trend reversal pattern and the downward movement that occurred, it also showed the resistance point. So it is expected that the price would move downwards.
 Source: Tradingview
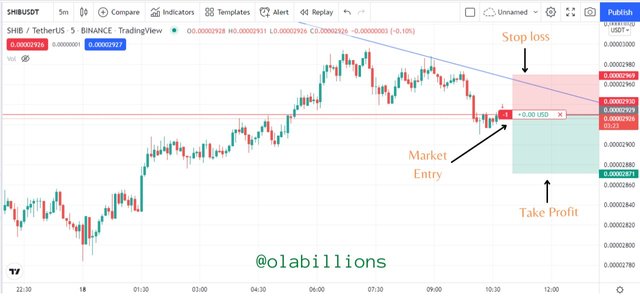
 So I placed a sell entry after getting so many confirmations from the higher timeframes. The stop-loss was placed just above the resistance level (the trendline), and the take profit was placed at a ratio of 1:2.
 Source: Tradingview
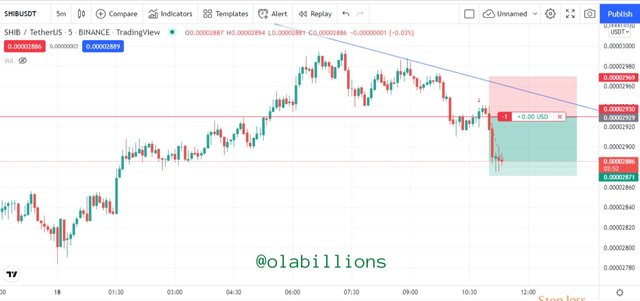
 After a small time, I checked the trade, and this is how the market moved. It was a successful trade.
 Source: Tradingview
 This is the history of the transaction which serves as proof that the transaction is legit.
Conclusion
Price action is a very interesting aspect of technical analysis, it helps traders to get useful information about the price of an asset. They can identify support & resistance levels, current trends, and trend reversal. They can also use it to get a clue on the prevailing sentiments of the market.
It is a technical analysis method that works very well with other technical tools, as a matter of fact, it enhances them as it helps confirm signals that those other trading tools give out. One very good price action method is the multi-timeframe analysis. It is a method of confirming trends, getting good entries, and tighter stop-loss.
I was able to use the multi-analysis method to spot a trend and place a good market entry, and at the end of the day, that trade was executed successfully.


Congratulations, your nice post has been upvoted by the steem.skillshare curation trail!
please check out this post:
steem.skillshare curation trail post to get infos about our trail
Bittorrent Golden Wallet Prizes
For steemit users prizes are distrubuted based on their profile reputation Point. Don't get behind Sign in Now CLICK HERE and claim your Prizes now
Reputation Point based Prizes: