Spot the century
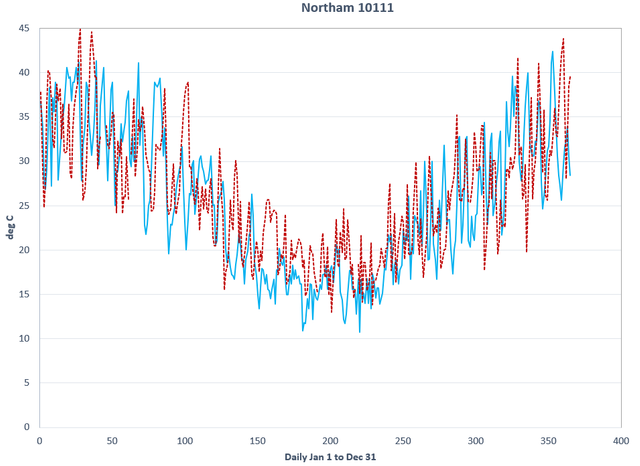
1920 or 2020? Northam Australia Edition
This graphic includes temperature readings for Northam, Western Australia, taken from January 1 to December 31. One of the lines represents the 1920 and the other 2020. You might deduce that the red line is 2020 because the winter is slightly warmer and there are greater extremes. It isn't clear that the average temperature has changed. It is obvious though that the alleged overall increase in temperature is not true.
Congratulations, your nice post has been upvoted by the steem.skillshare curation trail!
If you wish to join as well our trail and support our community, other users, and earn the curation reward, please check out this post:
steem.skillshare curation trail post
For more,you can visit this community
JOIN WITH US ON DISCORD SERVER: