All you need to know about candlestick chart in crypto trading.
Knowing how to read candlestick chat is one of the most important aspect for anyone who is planning to go into crypto trading. Most people think candlestick was invent by a modern trader due to presence of technology but that is not the case. Candlestick has been around since three centuries ago. It was invented by a Japanese rice trader called Munehise Homma in the eighteen century.
.png)
Image designed on canva.com
Homma uses the four candlestick elements which are Open, High, and Close, Low to form the price during the trading period. We see candlestick chat been use in almost, if not all financial markets as price representation. Now that we have known the brief history of candlestick chat, let define it and know how it works.
A candlestick chat can be define as a combination of several candle that helps a trader to foresee price movement in any given market or we can simple say a candlestick chat is a technical instrument which help trader with the complete visual representation of the price movement of specific product or item in a certain period of time.
Candlestick patterns are very important in trading because when it forms on a price chat, this can help crypto traders to anticipate price movement which can either be continual or reversals price movements. So with this information a crypto trader can know what to expect in term of price which is vital in buying and selling any assert for both short and long term.
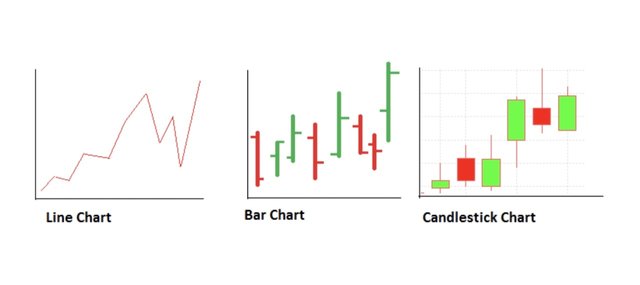
Let start by analyzing the visual look of a typical candlestick.
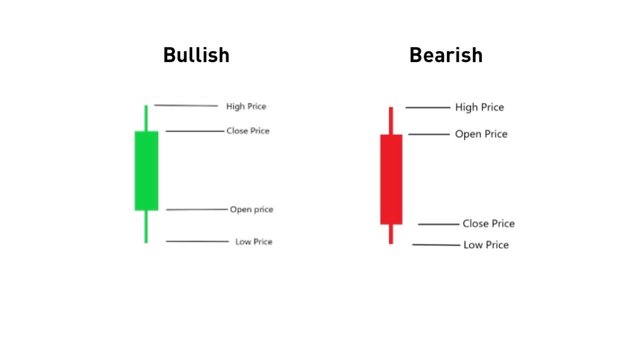
The “open” part of candlestick shows the price of an asset at the beginning of trading and the “close” part shows the price when the trade has ended. Likewise the “high” and “low” shows when the price is at the highest and lowest respectively.
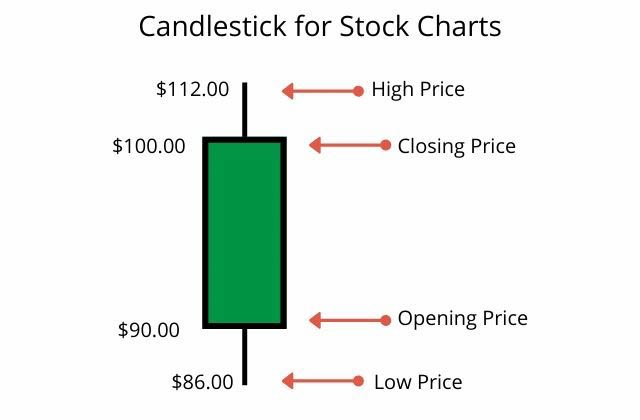
The green candlestick means bullish and it occur when the opening price is below the closing price which indicate rise in price, and we see the green candlestick due to buying pressure.
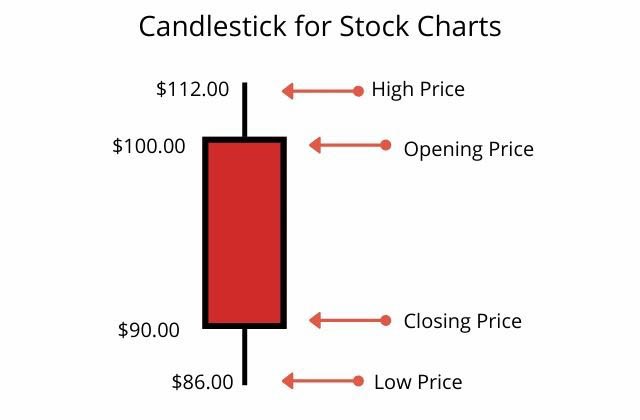
The red candle indicate a bearish sign which means the opening price is above the closing price which indicate price drop and red candlestick occur to due sell pressure.
NOTE: The Green and the Red candlestick are the default colors of all candlestick and you can change the color to any of your choice.
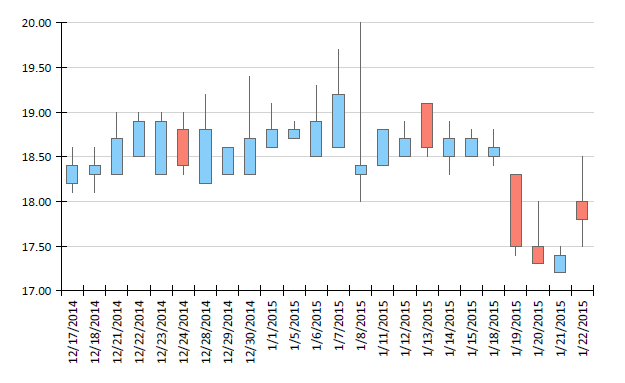
This is a type of candlestick chat that indicate the open, high, close, and low prices for a given time. The open price shows the price level of the previous candle when closed, which carry on to the current candle. Later on, when the prices moves up or down than this create a high or low. And lastly, when a candle closes at a certain price, this will point to a closing price. OHCL level appearance is important because the future price of any candlestick stock is dependent on it.
These trends usually indicate ups and downs of price movement of an asset on the candlestick chat. There are three types of these trends and they include:
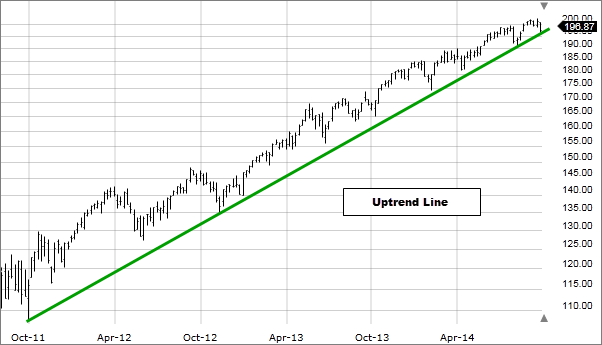
-Upward Trends: This situation occur when a chat current low points is higher than the old low point and also the current high point is higher than the old point. This a simpler team this shows an ascending pattern of the candlestick. This gives trader confident to carry on trading since the market is bullish.
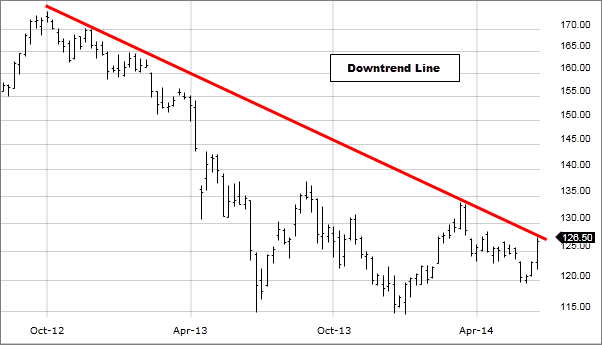
-Downward Trend: This is the opposite of upward trend. In this situation the current high point is lower than the old high point and current low point is lower than the old one. This means the market is generally bearish.
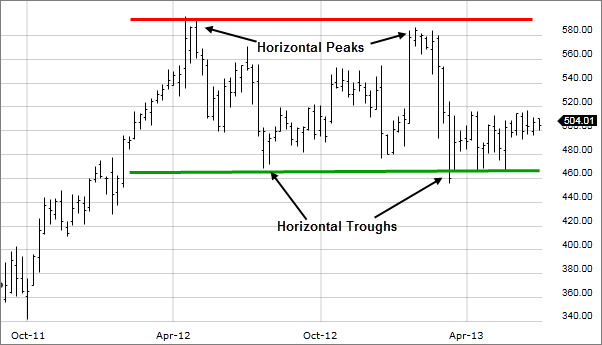
-Consolidation/ Sideways Trends: This is the last type of trend and it means the price does not move in one direction uniformly. It moves from high to low points been close to one another.
Understanding candlestick patterns is very important in technical trading. It helps to determine the possibility of price movement and also market trends which is based on past patterns. There are many candlestick patterns which helps signal bullish and bearish movement. But below I will be explaining some very important candlestick patterns you need to know before trading.
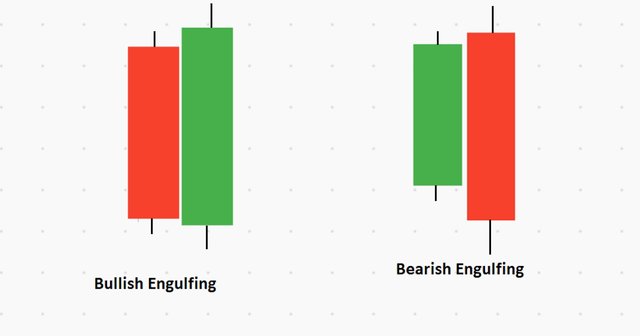
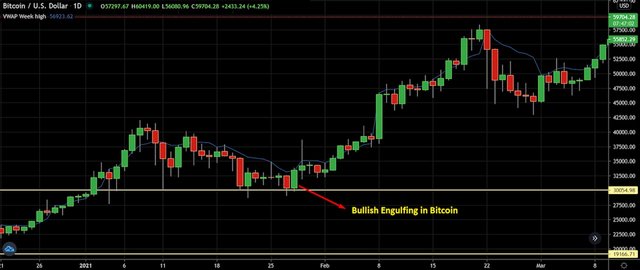
-Bullish and Bearish Engulfing: This is probability the most important candlestick patterns we should know and it the combination of red and green candlestick. This pattern is very easy to read. When a red candle is close and a green candle appear and it engulf the body of the previous candle, and when it closes, it higher than the last candle’s high (bullish). Bearish engulfing candle is different and in its own case a green candle appear first and the next candle is red and it engulf the body of the green candle which is the first.
-Hammer candlestick: This has a long wick at the downside and we see a small body of either bullish or bearish in the upper part of the candle. This type of candle indicate a form of tiredness and fatigue of an asset in the market and this means an upcoming reversal will occur anytime soon. For example in bullish, the sellers are in control than strong buyers who is pushing the price higher.
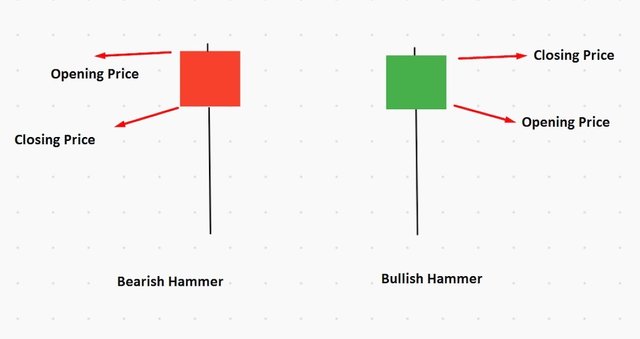
So it advisable when you want to trade using the hammer candlestick to wait and let the current candle to close and see the next candle before placing an order.
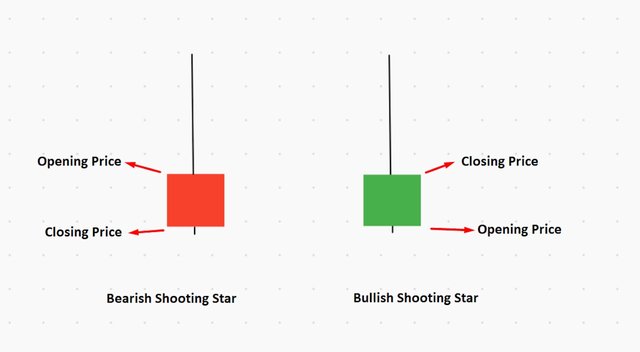
-Shooting star: This is the opposite of hammer candlestick. It can be identify by a long wick at the top of the candle and a relatively small body at the downside. It can also be bullish or bearish shooting starts.
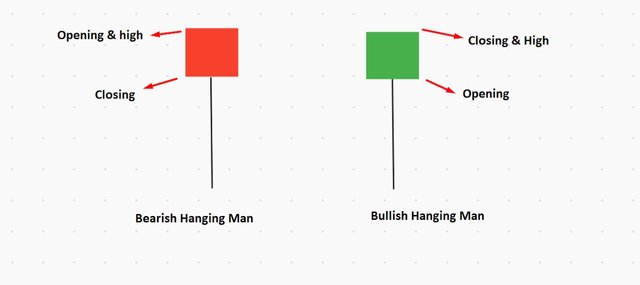
-Hanging Man: This is also similar to hammer candlestick, in this case we have the open, high and close prices in almost the same level. They is always a long shadow mostly twice the candle body. In bullish hanging man, both high and closing prices are same. In bearish hanging man both the opening and high prices are the same.
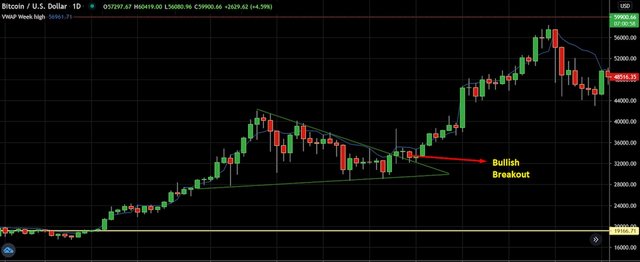
-Triangle Patterns: This type of pattern occur when both buyers and sellers seem to be at the same level which represent a form of indecisiveness about the market. So when the happen, the market begin to squeeze because of lack of availability of supply and demand. There are three types of triangle patterns and they are Ascending, Descending and symmetrical triangles.
Understanding candlestick and candlestick patterns is very important and it among the first thing any crypto trading should know before trading. I hope this post is helpful to anyone who is planning to start trading or has already been involve in trading.
Thank you all for reading see you next time.
NOTE: 10% payout goes to the community account.
References: Click Here
Twitter shared link
https://mobile.twitter.com/AbdulganiyuAh17/status/1518524488824111105
Upvoted! Thank you for supporting witness @jswit.
Please check my new project, STEEM.NFT. Thank you!
@tipu curate 50%
Wawa😂
🤣🤣🤣🤣🤣📯 Guyyyy
Note: You must enter the tag #fintech among the first 4 tags for your post to be reviewed.
Thank you professor @shemul21 for your support
Actually, candlestick patterns are very important to predict the market by using technical analysis knowledge. Today you have provided very important explanations. By the way, candlestick chat? It should be candlestick Chart I think.
Yea i totally miss that thank you for your correction and also for reading
You are most welcome brother. Its a pleasure to read your post.