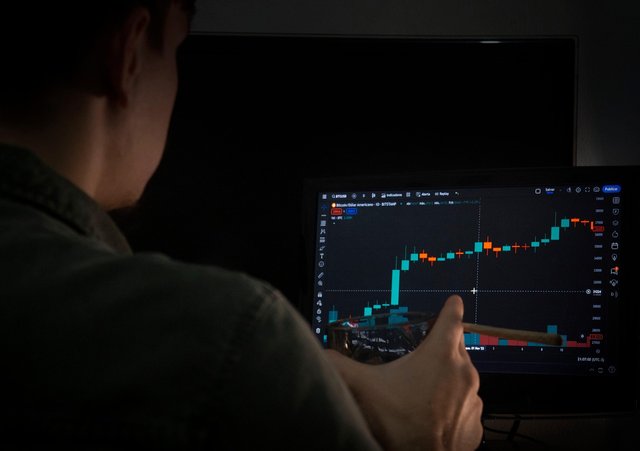
The basic components of candlestick charts for newbies
Friends, when you first enter the crypto world, does looking at candlestick charts feel like reading a foreign language? Many of us do not know how to analyze the candles properly when we come to the market. But it is very important for us to know. So I will try to write about this in two parts in a row to explain it to you easily. Today, as the first part, I will try to discuss it with you easily and I hope it will be useful for you. The red and green bars make your head spin? Don’t worry, today I will explain it in simple terms, and I guarantee you won't feel confused when looking at the candlestick chart after this!
Let's first talk about the basic components of candlestick charts, just like we need to know basic data such as height and weight when looking at a person.
Opening price is the price of the first transaction at the beginning of a trading day. For example, if a coin opens at 6 AM and the first transaction is at $100, then $100 is the opening price.
Closing price, corresponding to the opening price, is the price of the last transaction at the end of the trading day. For that coin, at 11:59 PM when the market closed, the last transaction was at $110, so $110 is the closing price.
The highest price, is the highest point the price reached during the day. For example, if the price of the coin rises to $120 during the day, then $120 is the highest price. The lowest price, is the lowest point the price reached during the day. For instance, if the lowest point of the day was $90, then $90 is the lowest price.

tweet link
Upvoted! Thank you for supporting witness @jswit.
Simply explained some basic tools for newbies. Thanks.
Thanks brother
The basic components of candlestick charts for newbies is the great post you have shared.