What types of Indicators are used in Crypto Market
What types of Indicators are used in Crypto Market.
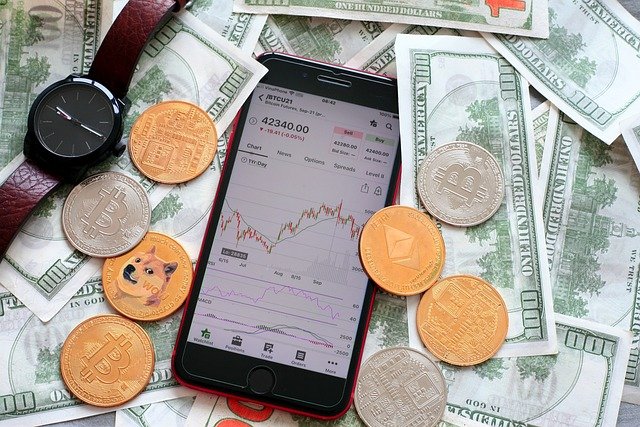
There are several types of indicators used in crypto markets to analyze and make predictions about the price and performance of different cryptocurrencies.
Moving averages:
These indicators smooth out the price action of a cryptocurrency by calculating the average price over a specific period of time. They are commonly used to identify trends and potential buying or selling opportunities.
Relative strength index (RSI):
This indicator compares the magnitude of recent gains to recent losses to determine if a cryptocurrency is overbought or oversold.
Bollinger Bands:
This indicator consists of a moving average and two standard deviation lines that are plotted above and below the moving average. The bands widen when volatility increases and contract when volatility decreases, providing a visual representation of volatility in the market.
Ichimoku Cloud:
This indicator is a comprehensive charting system that provides various signals, including trend direction, support and resistance levels, and momentum.
Fibonacci retracement:
This indicator uses horizontal lines to indicate areas where the price of a cryptocurrency is likely to experience support or resistance.
Volume:
This indicator measures the number of trades made during a specific period of time and is used to confirm trends and potential buying or selling opportunities.
MACD (Moving Average Convergence Divergence):
This indicator is used to identify changes in momentum and trend direction.
Stochastic Oscillator:
This indicator compares the closing price of a cryptocurrency to its price range over a specific period of time. It is used to identify potential overbought or oversold conditions and potential buying or selling opportunities.
On-Balance Volume:
This indicator uses volume to predict changes in the price of a cryptocurrency. It is calculated by adding the volume of a cryptocurrency on up days and subtracting the volume on down days.
Aroon:
This indicator identifies the strength of a trend and the potential for a trend change. It consists of two lines, Aroon up and Aroon down, which oscillate between 0 and 100 and are used to determine the direction and strength of a trend.
Conclusion.
These indicators can be used in combination with technical analysis, fundamental analysis, and other methods to make predictions about the price and performance of different cryptocurrencies. However, it is important to keep in mind that no indicator is 100% accurate and that past performance is not necessarily indicative of future results. It is also important to consult different sources and perform your own research before making any investment decisions.
@maqbool12
Great explanation of the various indicators used in the crypto market. Your description of each indicator is clear and concise, making it easy to understand their purpose and usage. The reminder to consider other sources and perform personal research is a valuable point for any crypto investor. Well done!
Bundle of thanks appreciate me
Greetings, you have been supported by @hindwhale account for your post. To know more about our community, you can visit our introduction post here. To contact us directly, please visit our discord channel.
Telegram ----- Discord