Top Down Analysis Of ETHUSDT Using Support And Resistance Strategy And RSI Indicator As Confluence

Hello great minds,
It is a great opportunity to come before you all today to share my technical analysis on eth against usdt.
I believe you are all doing perfectly well and are enjoying your activities in the community as you actively promote steemit across various social media platform.
Ethereum is a very big cryptocurrency in the cryptospace and we are well aware of this.
Ethereum happens to be the second most biggest and popular cryptocurrency in the cryptospace.
After Bitcoin which is the driver of all other tokens, ethereum is known to be the next most valuable token, and I am here to share my analysis to it.
ANALYSIS USING SUPPORT AND RESISTANCE STRATEGY
I begin my technical analysis from the higher timeframe, then I descend to the lower timeframe
On the higher timeframe, ideally the monthly timeframe, I seek to determine market trend
The monthly timeframe helps to eliminate market noise from the market and also compress the market to one screen.
And from this, it becomes very easy for the market trend to be predicted.
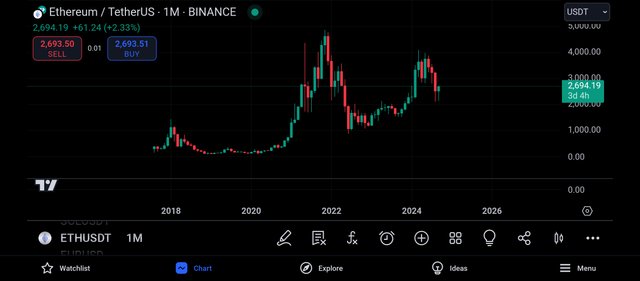
The screenshot above is that of the pair ethusdt on the monthly timeframe.
And as seen above, there are lesser candles on this timeframe and this is as a result of the time it takes for one of this candles to be formed.
On the monthly timeframe, it takes the time period of 1month for each candle to be formed.
And also, it is easy for the overall trend of the market to be detected on this timeframe, as we can see that the market is being bearish.
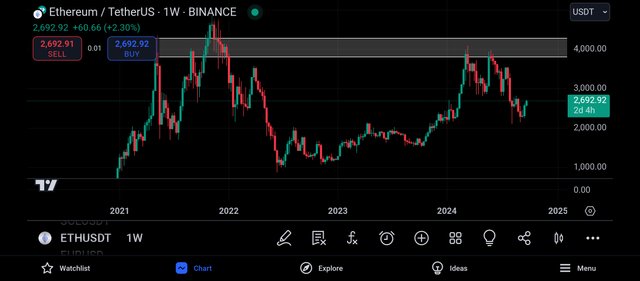
I then continued my analysis by moving to the weekly timeframe and on this timeframe, as expected, I could see more candles than on the weekly timeframe.
And looking at this timeframe more carefully, I was able to identify a key level and this level will be functioning as a resistance level to the market price, and the market is expected to be rejected whenever it trades towards this level.
And looking at the market, I could see that the resistance level is responsible for the most recent bearish move on the price chart.
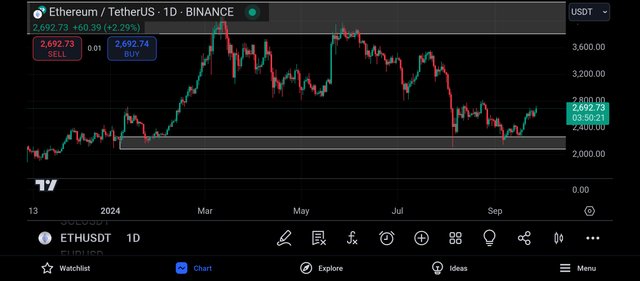
And moving to the daily timeframe, I could see the market more clearly and I could see more candlestick on this timeframe.
Also, I was able to identify another key level and this level is functioning as a support level to the market, and this implies that there are lots of buyers on this level, thus preventing the price from falling below this level
This support level can be said to be a valid support level as it has been severally respected by the market, and as such, we can expect to be respected again.
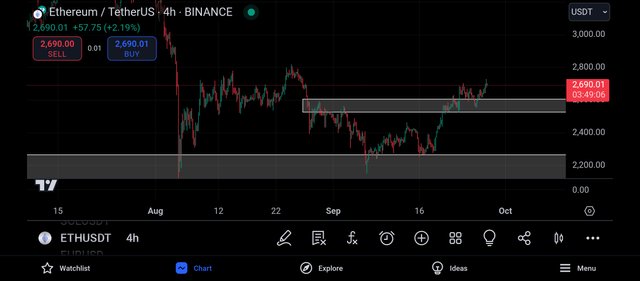
And moving to the daily timeframe, I could see lots of noise in the market, as the buyers and sellers are struggling to drive the market to their preferred direction.
And looking very carefully, I was able to find another level and this level can be seen to be currently functioning as a support level, although it was a resistance level that got broken.
And from the above screenshot, we can see that this level got broken, the market retraced and retested this broken level which gives us a confirmation for a bullish Market move.
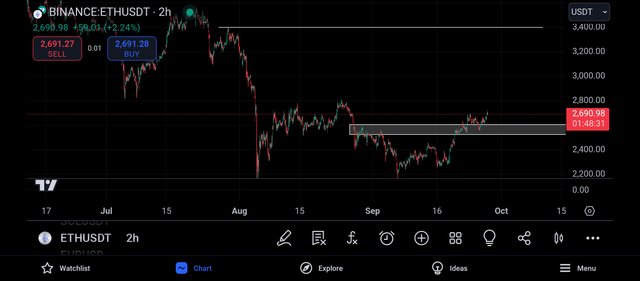
And getting to the 2hr timeframe, I decided to search for my entry into the market, and I am approaching this timeframe with a bullish bias on the market.
And looking at the market carefully, I decided to enter from the market closest support level and before then, I decided to search for confluence using the relative strength index indicator.
CONFLUENCE USING RELATIVE STRENGTH INDEX INDICATOR
The relative strength index indicator is an indicator that helps to identify overbought and oversold market.
When a market is spotted to be overbought, it is a bearish trend reversal signal and when it is oversold, it is a bullish trend reversal signal.
An overbought market can be spotted when the rsi crosses above the 80% line and an oversold market is detected when the market crosses below the 20% line.
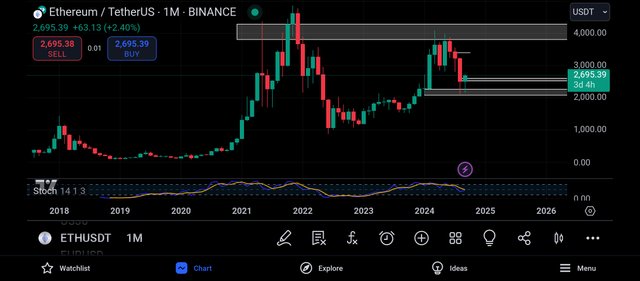
Applying the rsi to the monthly timeframe, I could see that the market is about to be oversold as it is approaching its 20% line, and when this happens, the market can be said to be oversold.
An oversold market is understood to be a bullish trend reversal market, that is, a market condition where the bears have become weak and the bulls have gained strength.
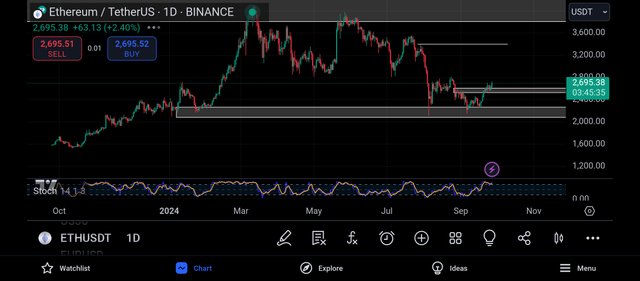
Applying the rsi to the daily timeframe, I could see that the market is being overbought and an overbought market is detected when the rsi crosses above its 80% line.
And an overbought market is understood to be the opposite of an oversold market, that is, it signals a bearish trend reversal.
It is a market condition showing the weakness of the bulls and strength of the bears.
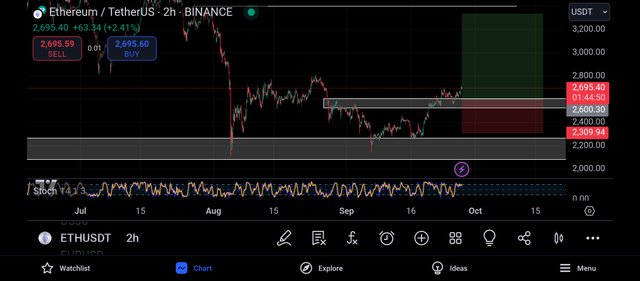
And moving to the 2hr timeframe with my bullish bias after searching for my trading confluence, I decided to place my entry on the closest support level and my take profit was placed on the closest resistance level of the market.
CONCLUSION
I have shared my analysis on ethusdt beginning from the monthly to the weekly to the daily and to the hourly.
From my analysis, I expect to see a bullish move on ethusdt.
https://x.com/JuecoYoung/status/1839770339254956424
Upvoted! Thank you for supporting witness @jswit.