Understanding the Volatility Stop Indicator and how it is calculated.
Greetings dear friends,
It's a new day of the week and I'm delighted to share my knowledge of the volatility stop indicator with you all today. This is an indicator that talks about trend change as it focus on the stop loss level of the said asset.
Background image Edited on Canvas
Also, this indicator uses the ATR which is the average true range of an asset along side it multiplier over a given period to calculate the stop price of the asset. This implies that for those trading the pair of crypto asset, you can use this indicator to know where you are to place your stop loss.
Always this is where most traders have issues when trading the crypto asset as they hardly know where to set their stop loss level. So if you are in this category please read till the end to know how to effectively calculate the level of your stop loss.

The volatility stop indicator was developed by J. Welles Wilder in 1978. He created this because of the volatility in the financial market and he needed to be sure where to place his stop loss in his trade so as to minimise his losses and maximise his profit.
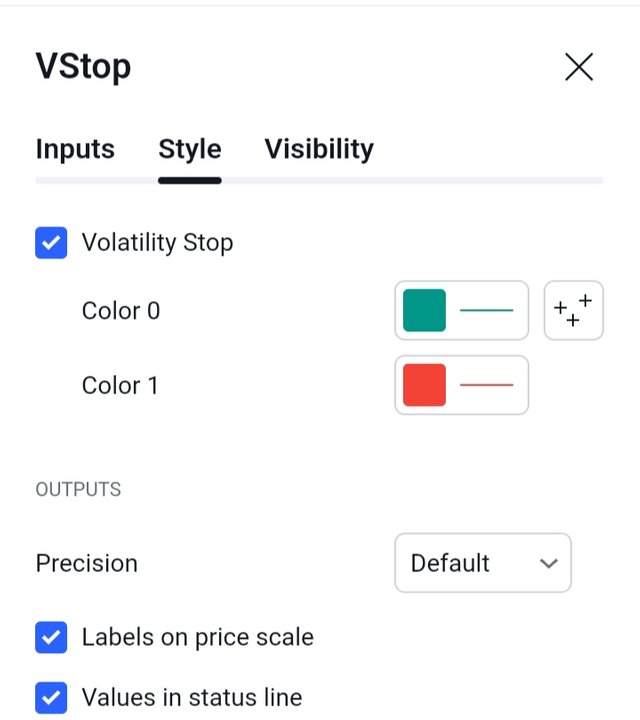
The technical indicators is designed such that it has two major lines to indicate when the market is bullish and when the market is bearish. These two lines are of the colour red and green for bearish and bullish market respectively.
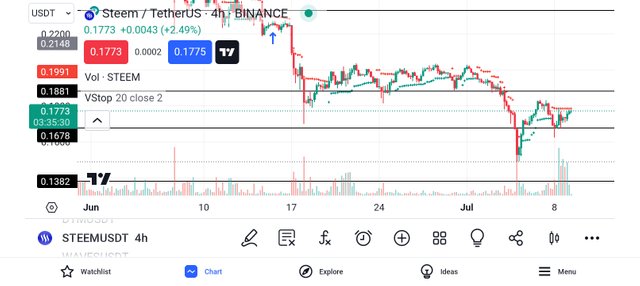
If the line is seen at the top of the price chart it is always red in colour indicating that the price of the asset is on a downtrend. If the line is seen below the price chart, it indicates an uptrend meaning the colour is green.
Reversal to another direction of the price of the assets depends on the change in the colour of these lines. So if the line cross the price chart, the colour changes to the opposite i.e., if it is a red line, once it cross the price chart it turns green and the trend changes direction. If it's a green line thesame happens to it as well.
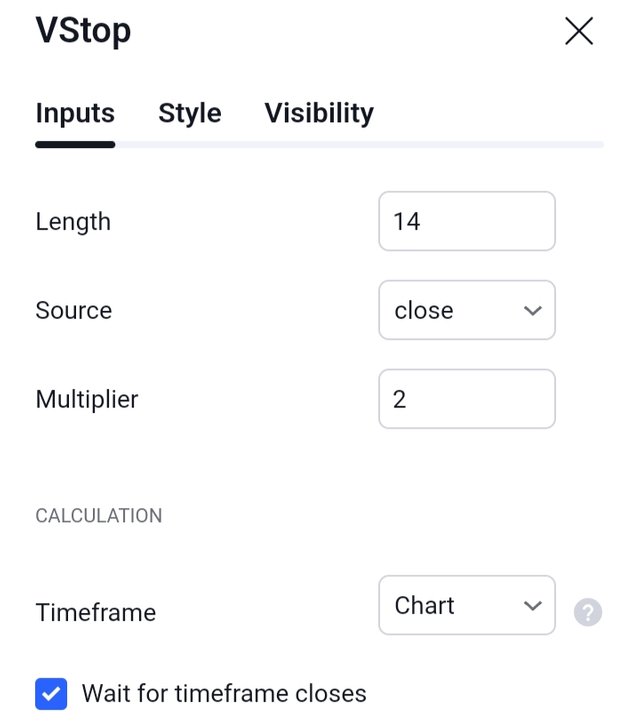
To calculate the volatility stop indicator, you need to take into consideration some key things and that include the current price of the asset, the ATR (which is usually calculated over a period of 14 days by default) and the multiplier which is usually 2 by default.
 |  |
|---|
So having all of these, you are going to calculate the Stop distance and the Stop price.
Where ;
Stop distance = ATR * Multiplier
Stop loss or price = Current price - stop distance
Example
If you are given the following data below and you are asked to calculate the volatility stop indicator
Given
Current price = $200
ATR = $10 (over a period of 14 days)
Multiplier = 2 (by default)
Find the volatility stop indicator
From the above you are to firstly calculate the stop distance and the formula is given as
Stop distance = ATR * Multiplier
Stop distance = 10 * 2
Stop distance = $20
Secondly, let's calculate the stop price
Stop loss or price = Current price - stop distance
Stop loss or price = 200 -20
Stop loss or price = $180
So with these results, if you are to place your stop loss based on the above data, the volatility stop indicator will place your stop loss at $180 when the current price is $200. This means that you are going into the market with the mindset of losing only $20 if the market doesn't go in your direction.
The essence of the volatility stop indicator is for us to know where to place our stop loss when trading any pair of asset. Remember this is dependant on the ATR and the multiplier. So the above example is just a guide and if you wish to check or calculate the stop loss in any trade you are into them you must consider using the actual or current price of the asset at the time carrying out your calculations.
Note: This is a simplified example and actual calculations may vary depending on the specific VSI implementation and parameters used.
Finally, I want to thank you all for reading through my post today. If you have any questions or contributions, please do well to use the comment section of this post. See you all in my next publication.
Disclaimer: This post is made as an education and not investment advice. Digital asset prices are subject to change. All forms of crypto investment have a high risk. I am not a financial advisor, before jumping to any conclusions in this matter please do your research and consult a financial advisor.
NB: All images except otherwise stated are mine and taken from the TradingView.
Thank you, friend!


I'm @steem.history, who is steem witness.
Thank you for witnessvoting for me.
please click it!
(Go to https://steemit.com/~witnesses and type fbslo at the bottom of the page)
The weight is reduced because of the lack of Voting Power. If you vote for me as a witness, you can get my little vote.
https://x.com/xavierf14044615/status/1810597574497214740?t=5Peu4FXyc-6X1fkd0cafTg&s=19
💯⚜2️⃣0️⃣2️⃣4️⃣ This is a manual curation from the @tipu Curation Project.
Also your post was promoted on 🧵"X"🧵 by the account josluds
@tipu curate
Upvoted 👌 (Mana: 6/7) Get profit votes with @tipU :)
Note:- ✅
Regards,
@jueco