[2021:160] Blockchain Word Of The Day #02 : GOLDEN CROSS (Bilingual [en/id])

English
Golden Cross is a term related to trading activities. This term appears in the use of the Double EMA (or DEMA, Double Exponential Moving Average) indicator on the chart. Double EMA means the use of two EMAs simultaneously, one EMA is set as the shorter period and one in the longer. Different combinations of periods for each EMA are used by traders. Every trader will find a suitable EMA combination to use. One popular combination is the EMA-15 and EMA-50.
Golden Cross occurs when the short-term EMA line crosses the long-term EMA line from below and stays on top for some time. Golden Cross can be an early signal that confirms a trend reversal toward an uptrend.
The image below shows the ETH/USD price line chart of TradingView in a 4-hour timeframe.
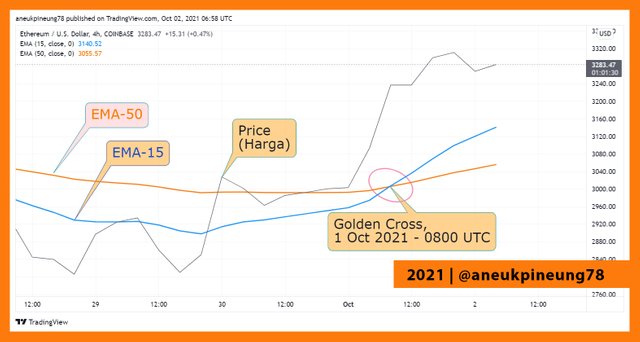
The chart uses a combination of EMA-15 (blue line) and EMA-50 (orange line). The black line on the chart is the price line. Seen EMA-15 (short term) crossing the EMA-50 (long term) on October 1, 2021 at 08.00 UTC. This cross is known as the Golden Cross. This is an early signal of a trend change from previously bearish to bullish (uptrend).
Previous Words
- HARDFORK, 20211001;

Bahasa Indonesia
Golden Cross adalah istilah yang berkaitan dengan kegiatan perdagangan. Istilah ini muncul dalam penggunaan indicator Double EMA (atau DEMA, Double Exponential Moving Average) pada chart. Double EMA artinya penggunaan dua EMA secara bersamaan, satu EMA diatur dalam periode pendek dan satu dalam periode lebih panjang. Berbagai kombinasi angka untuk masing-masing EMA dipergunakan oleh para trader. Setiap trader akan menemukan kombinasi EMA yang cocok untuk dipergunakannya. Salah satu kombinasi yang populer adalah EMA-15 dan EMA-50.
Golden Cross terjadi ketika garis EMA jangka pendek memotong garis EMA jangka panjang dari bawah dan tetap berada di atas untuk beberapa lama. Golden Cross bisa menjadi sinyal awal yang mengkonfirmasi terjadinya perubahan trend menuju uptrend.
Gambar di bawah memperlihatkan grafik garis harga ETH/USD dari TradingView dalam timeframe 4 jam.
Dalam chart tersebut dipergunakan kombinasi EMA-15 (garis berwarna biru) dan EMA-50 (garis berwarna oranye). Garis hitam di dalam chart adalah garis harga. Terlihat EMA-15 (jangka pendek) memotong EMA-50 (jangka panjang) pada 1 Oktober 2021 jam 08.00 UTC. Pemotongan ini dikenal dengan istilah Golden Cross. Ini menjadi sinyal awal perubahan trend dari sebelumnya bearish menuju bullish (uptrend).
Kata-kata Sebelumnya
- HARDFORK, 20211001;

Steem On. Thanks For Stopping By.


Shared to Twitter: https://twitter.com/aneukpineung78a/status/1444204464366186497.