Introduction to Fundamental and Technical Analysis | 20% to steemit-pak by @abdul-saboor
Hello friends,
I hope you're enjoying yourself. I want to share some of the information regarding fundamental and technical analysis so here we start with definition and differences.
What are the differences between Fundamental Analysis and Technical Analysis? Which one is used most often?
.jpeg)
Fundamental Analysis:
Fundamental analysis is defined as the method of measuring an intrinsic value of a stock or other security for the purpose of analyzing it However, Intrinsic value is also a fundamental value which is independent essential value of resources in its market value.
Fundamental analysis used two types of analysis one is Quantitative analysis and other one is Qualitative analysis.
Fundamental analysis embrace a long-term perspective for investors to invest long term.
Fundamental analysis is useful for those who wants to invest for the long time period.
In fundamental analyis the data which is needed to collect is collected through financial statements and further by financial ratios.
Fundamental Analysis is the study of profit and loss statements, Balance Sheet, Financial statement amd ratio.
Fundamental analysis looks both back and forward trends
Moreover, Fundamental analysis os used to calculate the over and under values of stocks
Technical Analysis:
Technical Analysis is defined as the method, by using charts and technical indicators, technical analysis explains how to predict how the stock price will behave based on previous price and volume trends.
Technical analysis analyse from the previous trends of the movement of stock prices.
Technical analysis embrace a short-term perspective for investors to invest short term.
Technical analysis is very beneficial for those who wants to trade and wants to earn in short time period.
In Technical analysis the data has been collected through charts for example relative strength index.
Technical analysis is the study of resistance and relative strength index.
Technical analysis just looks at it's past trends.
Technical analysis is used to check and analyse the stock as it's able to sell or buy.
Usage:
Both play a very vital role when it comes to work. However when people wants to know about the clear picture of trade and numbers they approach to the technical analysis and the investor needed to know about the long term investments investor use fundamental analysis. Moreover of the investors wants to know about the under value and over values of stocks investors approach fundamental analysis and of they only wants to know the good time period selling and buying of stock they approach technical analysis.
Choose one of the following crypto assets and perform a Fundamental Analysis indicating the objective of the Project, Financial Metrics and On-Chain Metrics.
Cardano (ADA)
Solana (SOL)
Terra (MOON)
Chiliz (CHZ)
Polkadot (DOT)
Below are the Fundamental Analysis indicating the objective of the project, financial Matrices and on Chain matrices.
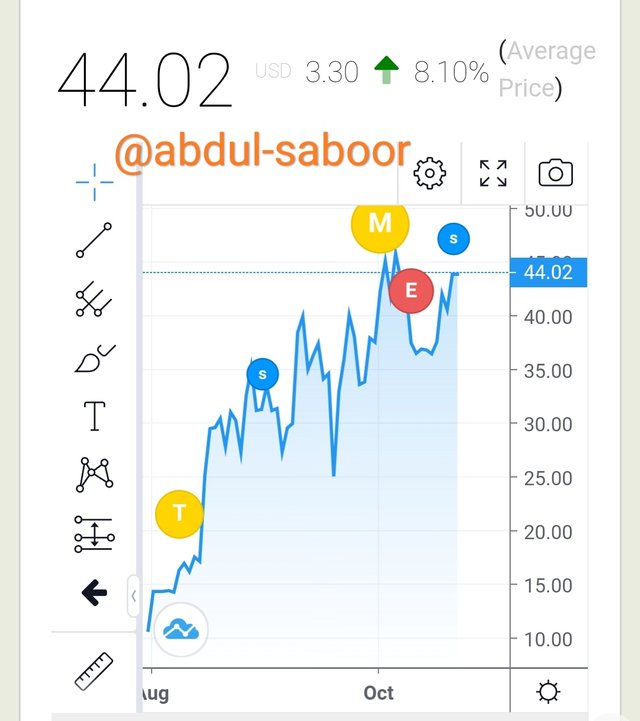
Terra is currently trading at a share price of 44.02, on very low volumes, which could encourage investors to take a closer look at the coin.
According to Terra, Daily return of the cryptocurrency standard deviation is 11.87 for nighty days investment. Acording to the report Some of terra partners earn a lot from it which swings the high volatility in recent market.
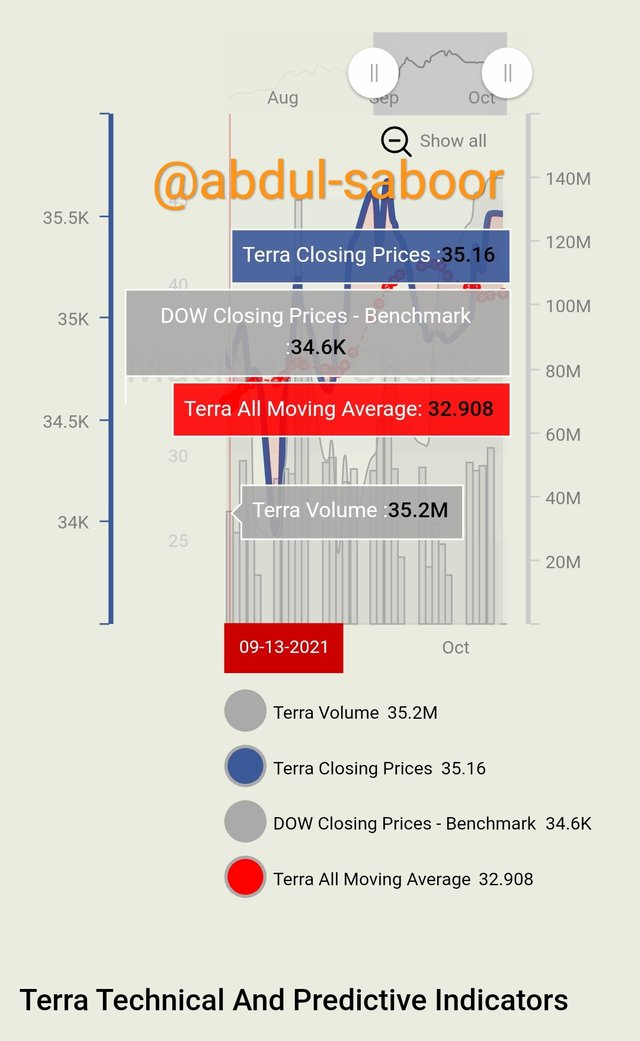
Terra Technical And Predictive Indicators
The Terra crypto coin analysis gives the required and detailed information and makes easy to have information released by the public and government.
Terra Investment Alerts:
In Terra Investment Alert it helps and support in investing judgement of an individual by generating automatic signals whichmakes you understand about what to buy and how to avoid mistakes.
Management Efficiency:
It helps and used to manage the operations and company liabilities and other expenses.
Technical Driver:
In terms of technical indicators, Terra's model allows an individual to easily check the terra's current technical drivers by using a Semi Deviation of 6.87, Adjusted Risk Performance of 0.2064, and Coefficient of Variation 358.92 as today 23rd October.
Terra Forecast Models:
It is the Model which tells us the future value by observation of past values through whicch it maximize the return profit.
Thanks for reading and learning.
If you want to know more about me here is the Introduction

DON'T FORGET TO FOLLOW @steemitblog FOR MORE UPDATES 💝💓
Thankyou for reading. Have a great Day ♥️
Yours, @abdul-saboor
A proud member of STEEMIT PAKISTAN community ❤️
Subscribe Steemit Pakistan

Join STEEMIT PAKISTAN
THE OFFICIAL STEEMIT PAKISTAN COMMUNITY
ITS OUR PLEASURE TO HAVE YOU HERE
FEEL AT HOME
A GIF BY @stephenkendal to #supportthediarygame

| 100 SP | 250 SP | 500 Sp | 1000 SP |
|---|---|---|---|
| Click | Click | Click | Click |
#betterlife #pakistan #steemit #steemexclusive #supportthediary #supportthediarygame #crypto #cryptocurrency
Nice post bro.