Steem Tutorial Contest: Understand What Is Average True Range in Trading
Designed with PowerPoint
Hello friend, I am excited to have you here today. I trust you are doing very well, my dear friend. As part of my entry to the Steem Entrepreneurs Community contest, I discussed "Average True Range" in this post.
I find joy in passing knowledge across to people, and I believe the best way that I can do that is by focusing on tutorial content. In order not to waste your time, let's take a look at what I have discussed about average true range (ATR) below.
Friends, we are all aware that volatility is a common part of trading, particularly when it comes to cryptocurrency. Due to the high level of volatility in the cryptocurrency market, traders frequently try to forecast and profit from price fluctuations.
Technical analysis and price volatility indicators like Average True Range are one option (ATR). It's an important technique to comprehend and have in their technical analysis toolbox for many traders. Let's learn more about the average true range in relation to it.
What Is the Average True Range?
The Average True Range (ATR) technical analysis indicator is frequently used to gauge market volatility over a specific time frame. The volatility indicator ATR was developed by technical analyst J. Welles.
Welles Wilder Jr. in his 1978 publication, "New Concepts in Technical Trading Systems." An average can be computed by computing and providing projected price volatility over several true ranges over a 14-day period in order to establish an average. ATR offers a number of advantages, including helping traders like you and me establish stop-loss prices, but it also has some drawbacks.
These low or high price volatilities are what traders take into account when deciding whether or not they wish to buy or sell assets during the period. It's vital to remember that ATR should only be used as a guide and that it merely approximates price volatility.
How to calculate the average true range
Finding the average true range, or TR, for a particular period is necessary to calculate ATR. To do this, you must compute three alternative ranges and choose the largest of the three:
The most recent period's high, less the most recent period's low.
The most recent period's high, less the prior close price, with no regard to any negative signs.
The absolute difference between the previous close price and the most recent period's low.
Depending on your attention time, the period may change. For instance, the time frame for cryptocurrencies could be 24 hours, whereas for equities it might only be one trading day. The true range is calculated for each sample in order to estimate the average true range over a time period (usually 14 days).
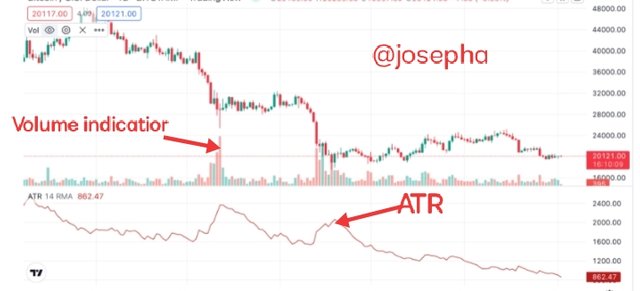
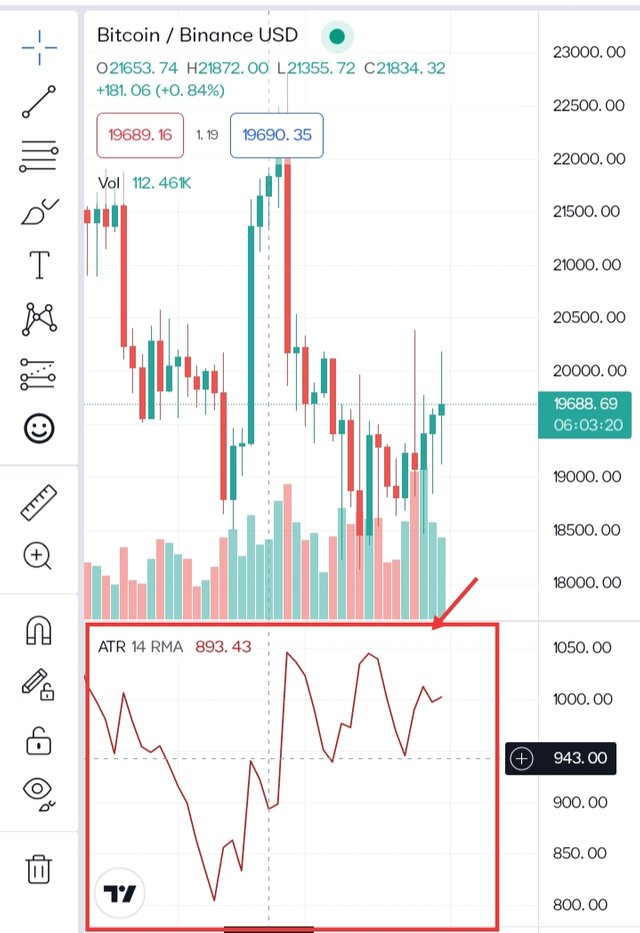
As a trader who want to be professional, you can learn more about the volatility of asset prices within a certain period by calculating the ATR for that period. A line representing ATR is typically placed on a trader's charts. The ATR line climbs as volatility increases, as can be seen in the graph below (in either price direction).
Adding and Viewing the Average True Range Indicator on Tradingview
In order for you to know the volatility of an asset using the average true range indicator, you will need to follow the steps below.
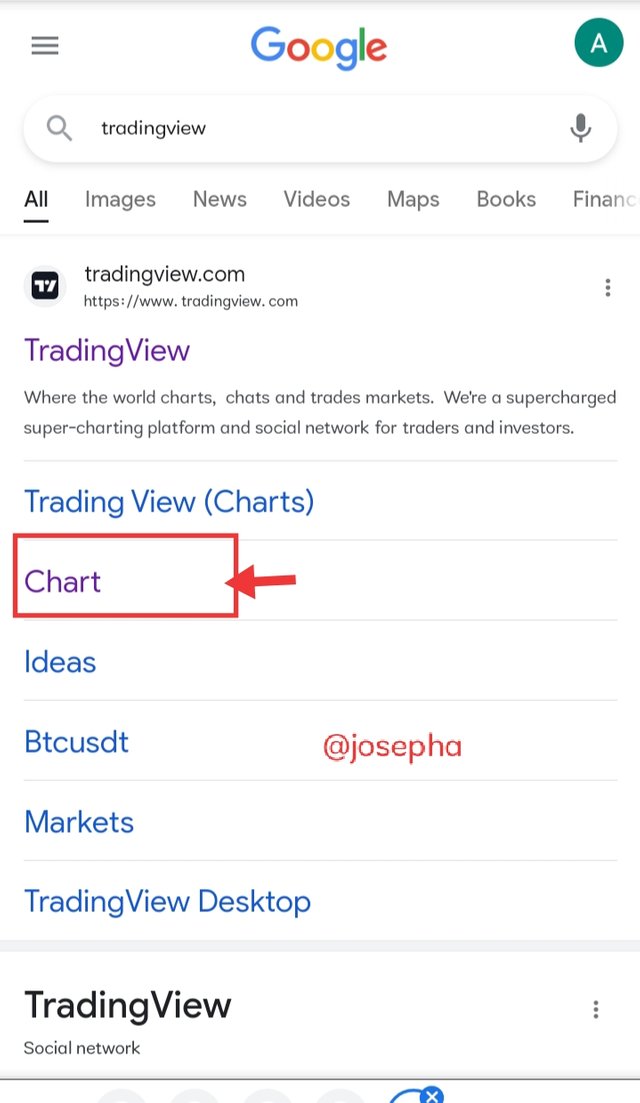
Step: 1 Open your browser and search for Tradingview. Click on the chart as shown below.
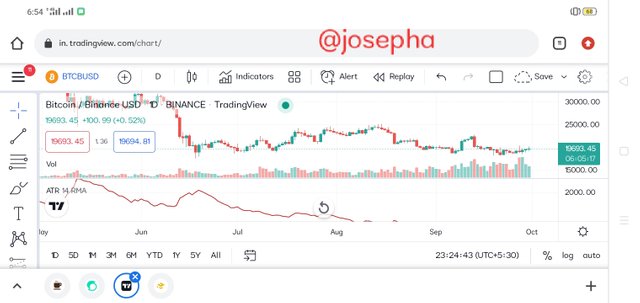
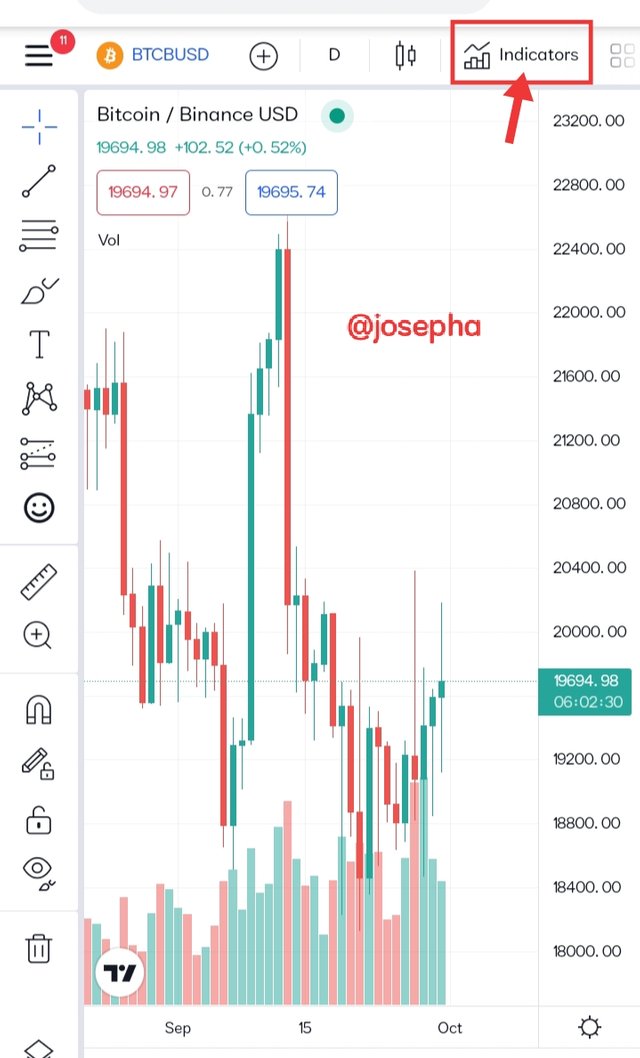
Step: 2 After you have clicked on the chart, you will be taken to the Tradingview page. Click on "Indicator" as shown from the screenshot below.
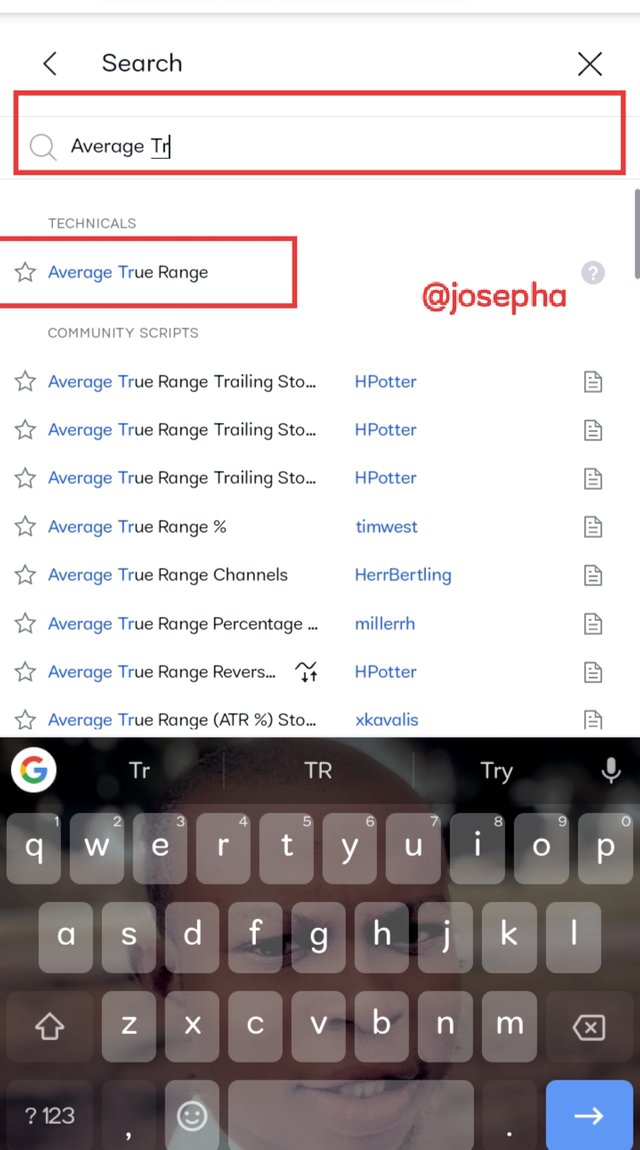
Step:3 By typing the word Average True Range into the search bar and clicking, you can find it.
Step:4 Once you have clicked, you will get the result as shown below.
Why do traders use Average True Range?
ATR is a popular tool used by cryptocurrency traders to gauge price volatility over time. Due to the extreme volatility seen in crypto markets, ATR is particularly advantageous in this industry. Using ATR to set take-profit and Stop-Loss orders is a popular tactic.
You can prevent market noise from impacting your trading tactics by employing ATR in this manner. You don't want daily volatility to prematurely close your positions if you're trying to trade a long-term trend that you believe exists.
The ATR is often multiplied by 1.5 or 2, and the result is used to set the stop-loss amount below your entry price. Your stop-loss trigger price shouldn't be reached by the daily volatility; if it is, this is a sign that the market is moving.
Challenges when using the average true range
Although ATR offers its users advantages due to its volatility and price change detection, it has two key drawbacks:
ATR can be interpreted in a variety of ways. This may be a drawback because no single ATR number can definitively predict whether or not a trend will reverse.
Because ATR only measures price volatility, it cannot alert traders to a change in the direction of an asset's price. As an illustration, some traders may mistakenly conclude that a rapid rise in ATR confirms a long-standing bullish or downward trend.
Conclusion:
Average True Range is one of the best known indicators that is used to determine the volatility of an asset, which is the reason why it is used by thousands of traders daily. I believe in this post you have been able to know what the average true range indicator is and how you can launch the indicator. For you as well, read through some of the tutorial posts below.
👉Tutorial: Understanding the difference between crypto and stocks
👉Tutorial: Learn How to Work With Icons Using Your Computer
| You can reach me via: |
|---|
| Discord: | josephafen#5962 |
|---|---|
| WhatsApp: | 08120419236 |
Written by:
@josepha
| 25% Goes to @null & 10% to @steemkindness |
|---|
I invite;
@simonnwigwe
@preye2
@yakspeace
Best regards to: @harferri @tucsond @subkiusman @f2i5 and @afrizalbinalka
Okay, for more details, you can drop your suggestions or questions in the comment section below👇.
You have really passed some knowledge to me sir, as I have got to know that Average True Range is an indicator that helps traders gauge market volatility within a given timeframe. I have learnt about it's importance and how it's calculated. Thanks for sharing sir, I will sure participate in this contest.
You're always welcome sir. Please do well and participate because I will love to read your entry.
Hello @josepha, thank you for participating in the Contest: Steem Tutorial - Edition 1. Interesting article for traders to increase their knowledge of calculating asset price volatility with the Average True Range indicator, good entry and easy for readers to understand.
Team verification results :
Kind regards,
Steem Entrepreneurs Team
We support quality posts anywhere and any tags.
Curated by : @simonnwigwe
but I prefer naked charts. but with the indicators it makes it easier for people to learn to read the future movement of market prices. good topic to read.