Starting Crypto Trading - Crypto Academy / S6W1 - Homework post for pelon53

Hello steemians, I would love to join Prof. @pelon53 to congratulate each and everyone for reaching the sixth season of the crypto academy. This week's topic is Starting Crypto Trading and I'll try my best to give detailed answers to the test questions listed. If you reach the requirements, you could join me to do same by reading up the lesson on this link.

1.)
In your own words, what is fundamental analysis? Do you think it is important for a trader? Justify the answer

Last season, we had lessons on various crypto currency projects like Terra, Avalanche and so on. Most times, in the assignments, we were asked to evaluate the project and find out if the project was worth investing in. This is typically fundamental analysis and this means we have all been using the strategy since the beginning of the "crypto academy".
Fundamental analysis is the research or examination of all factors and information about a particular crypto currency asset in order to determine if it is safe to invest in or not. It is basically, a process of analyzing how healthy a crypto currency project is and also doing some research on the team behind it. This is normally the first strategy a good trader should utilize before heading on to the the price charts.
There are some factors which fundamental analyst take into consideration before investing or during the hodling process of a crypto asset.
- Security condition: (News of a hack)
- Competition
- Use case and the Developers
- Crypto currency exchange listings

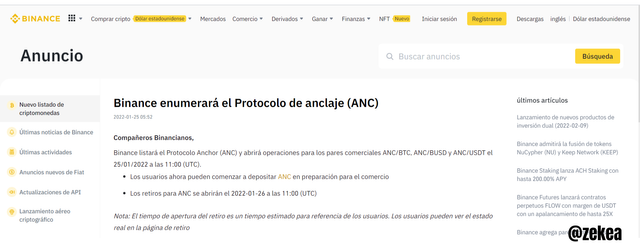
On the 2nd of February, this year, wormhole, (which is a platform on the Solana network that helps users convert SOL to other cryptocurrencies) was hacked and $326 million worth of assets were stolen. If you read the screenshot above you will see more details.
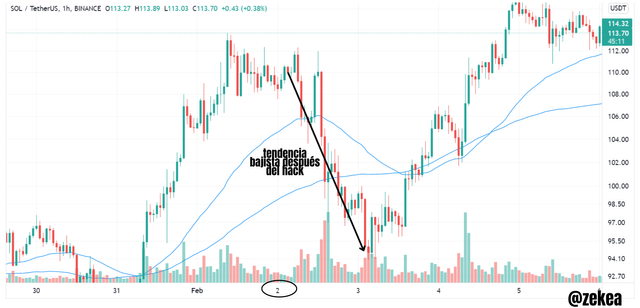
After such a tragic event, the SOL token dropped in value. It dropped from $112 to $94. A fundamental analyst who saw this news early enough would have used this as a trading opportunity to sell his SOL tokens at a high price and buy later at a cheaper rate.
Competition: This is a basic economic factor that affects every project. If developers on the Ethereum network decide to move their dApps to the Avalanche protocol because it has cheaper fees and faster transaction speed, the amount of users on the Ethereum network will be reduced and the ETH token's value will surely fall.
Usecase: The usecase of a crypto currency project is usually written in the whitepaper. Fundamental analyst can read up this whitepaper and find out if the platform will be of great use to the crypto community. Also, to find out if there is anything special or different from its predecessors (previous dApps with similar usecases). For example, Solana which was released in 2020 has a higher transaction speed and cheaper fees than Ethereum and that is why the SOL token had a massive growth in its value.
Crypto currency exchange listing: This is another vital factor that pumps the value of crypto currencies today. If the STEEM token is listed on binance. Steemit would be introduced to a new audience on the binance platform and this will surely increase the value of steem.
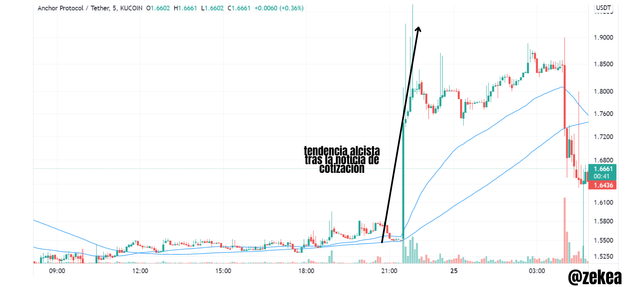
Using a real life illustration, the news for the listing of ANC was released on the 25th of January and analysts who heard of this purchased a lot of ANC tokens and this increased the value of the token, rewarding them with a lot of profit.
Do you think it is important for a trader?
Yes, fundamental analysis is very important to all traders because it provides the traders with all available information about the asset they are about to trade on. This simply helps the traders understand if a particular asset has high potentials or great use cases to be traded long term or should just be traded short term with the hype (hype is simply some promotions which increased the value of a token, it dies off over time).
A coin like ETH can fall due to some bad news but traders who have done their fundamental analysis on the ETH token know how important it is to the Ethereum network. Nothing can be done on Ethereum without ETH, so, they will not sell at a loss because they are sure that one day it will still increase in value.
2.)
Explain what you understand by technical analysis and show the differences with fundamental analysis
Technical analysis is the process of examining and studying previous price movements and patterns of assets in order to predict future trends in the market. This type of analysis requires a documentation of these "previous price movements" and that's why the Japanese candle sticks were invented.
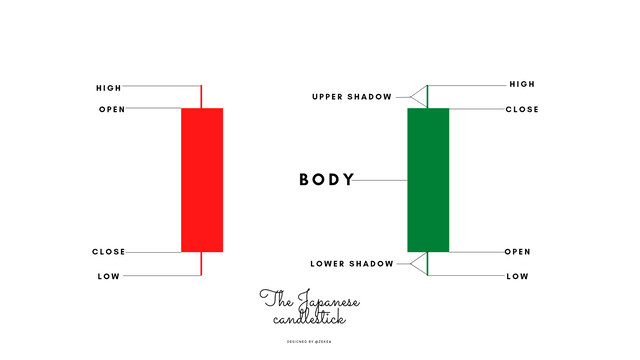
Almost everything we do in technical analysis involves the candlestick chart and that is because each candlestick contains huge data about all trading activities that occurs within a certain period in the past. It indicates what price the market opened at, the lowest price attained, the highest price attained and the closing price in the market.
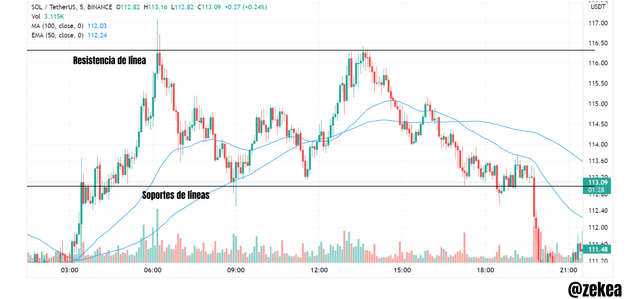
Technical analyst love to draw a lot of lines on the price chart and these lines are used to represent the support and resistance levels. If you look at the image above, I represented these lines.
Support: The support is usually the lower level on the chart. When the price action approaches it, a force opposes it and it goes back up again. In a case where the price action consolidates and breaks the support, traders predict a downtrend.
Resistance: This is usually the higher level on the chart. When the price action approaches the resistance level, a force opposes it and the price drops down again. In a scenario where the price breaks the resistance level, traders predict an uptrend.
Technical analysis also involves the use of patterns like flags, wedges etc. All these patterns still represent the support and resistance levels. Although, sometimes there is still possibility of faulty patterns and that's why traders also use indicators to confirm their prediction.
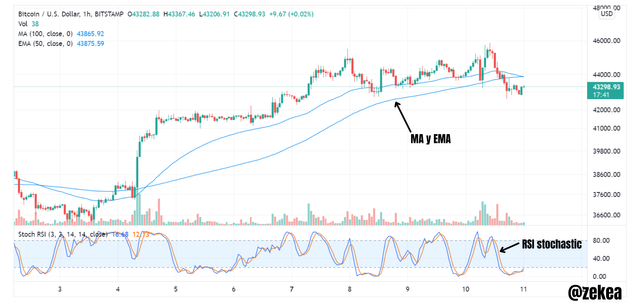
It is best to use a leading and lagging indicator. The leading is faster, it helps to fore see the next trend while the lagging confirms the trend. For the leading, traders can use the RSI stochastic while moving averages can be used for the lagging.
| Technical Analysis | Fundamental Analysis |
|---|---|
| Relies on past price movement patterns on the chart | Relies on the economic situation and use case of the asset |
| It is mainly used for short term trading | Mainly used for investment purposes. Although it can still be considered for long-term trades |
| Focuses on only previous data | Focuses on both previous and current data |
| Technical analysis is best used to decide when to enter and exit the market | Fundamental analysis is best used to decide on good and potential projects to invest in. |
From the above, the best option a trader has is to learn how to combine both analysis together.
3.)
Execute a sell order in the cryptocurrency market, placing the support and resistance lines
All images for this question from TradingView
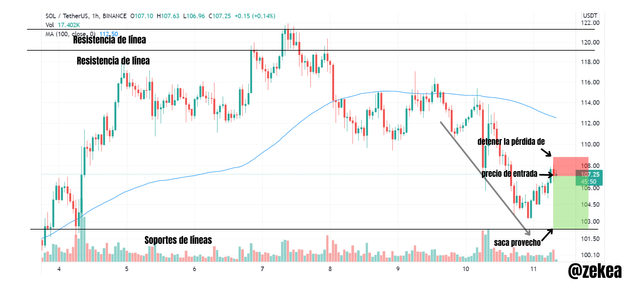
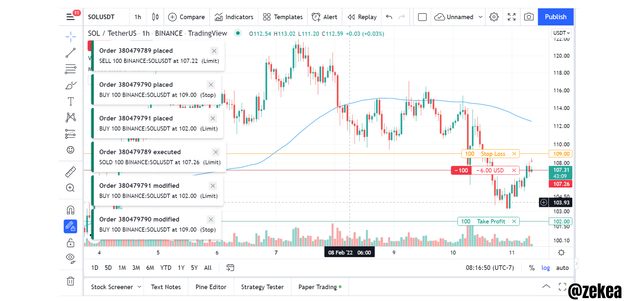
Here is the SOL/USDT chart where I did my analysis before making my Sell order. With my support and resistance lines, I was able to identify when to sell and also analyse where to insert my stop loss and take profit. My analysis were done on a 1 hour interval chart.
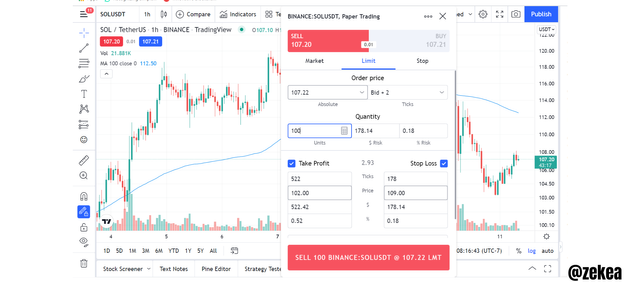
On my paper view demo trading account, I made a sell order at $107.22 for 100 units of SOL and set my take profit at $102.00 which is close to the support level on my chart above. At the end of the trade I expect to make a profit of $522.42 but since there are still possibilities of my analysis being faulty, I also set a stop loss at $109.
4.)
Execute a buy order in the cryptocurrency market, placing the support and resistance lines
All images for this question from TradingView
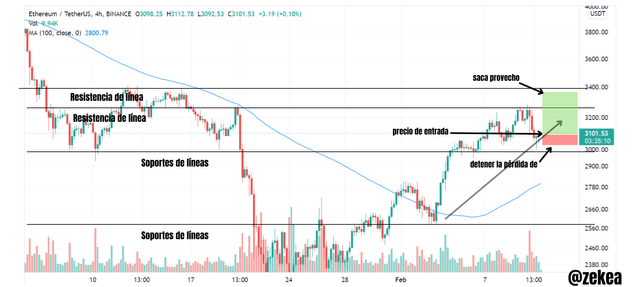
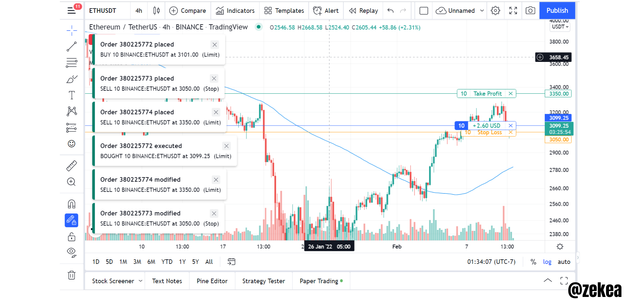
Above is the chart I did my analysis for my buy trade. This is the ETH/USDT chart, from my support and resistance lines I was able to estimate where to insert my stop loss and take profit. I used a 4 hour interval chart.
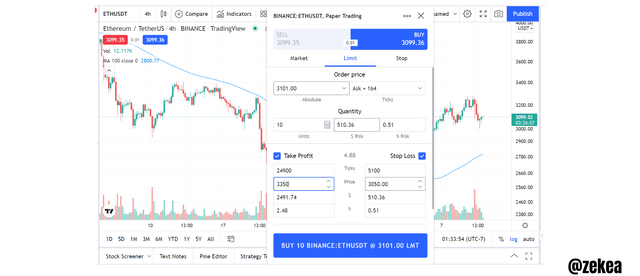
On paper view, I entered my buy trade at $3,101 for 10 units of ETH. I set my take profit at $3,350 which was close to my resistance level. From this trade, if everythings goes well, I expect a profit of $2,491.74 but if my analysis are faulty, there is a stop loss at $3,050 to control my losses.
5.)
Explain the “Hanging Man” and “Shooting Star” candlestick patterns.
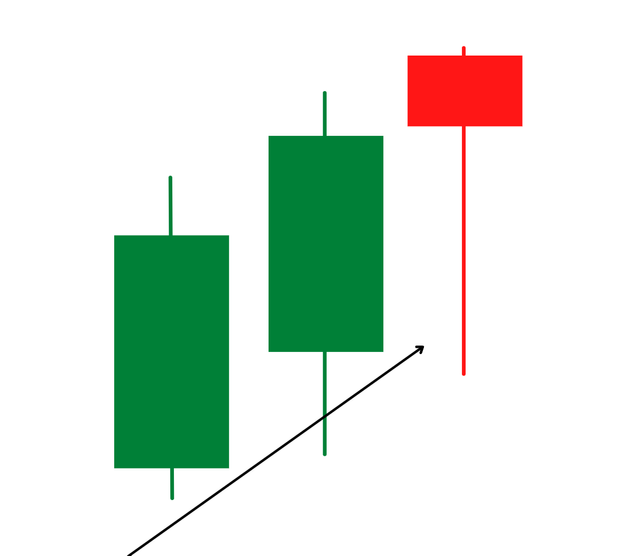
Candlesticks produce a lot of shapes and patterns which helps to pass a signal to the trader. The hanging man candle stick pattern is one of them. It is identified through its unique shape. Looking at the image on the left, it is the only bearish candle you can find there.
The hanging man is shaped with a very small candle body and a long tail. If you can remember my explanation about the Japanese candlesticks, each candle stick contains data of what happened in an interval. The long tail on the hanging man candle stick signifies that the sellers in the market were in control in the market which made the price to drop and at the lowest price, the buyers took over the market and closed the price near the opening price.
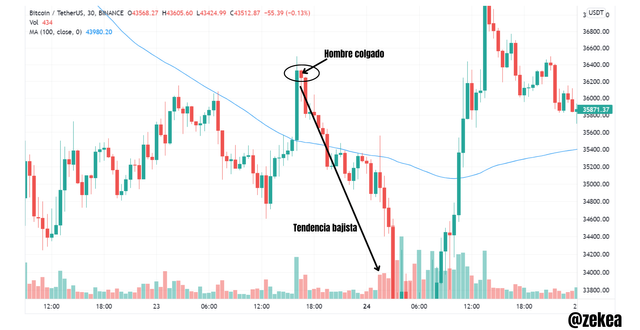
The hanging man shape appears after a bullish trend in the market and it tries to signify that the bullish trend is losing its strength and the market may divert to a bearish trend. Traders who see this candle stick shape most times prepare to make a sell order. For a real life example,
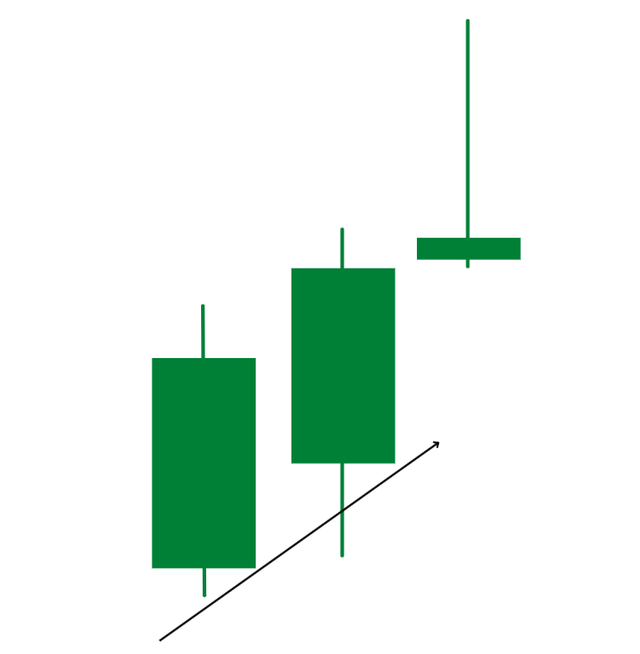
The shooting star candlestick is shaped with a small body and a very long wick at its upper side. Sometimes there is a small wick below or nothing at all. On the image at the left, I designed what it looks like, it is the third candle stick from the left.
The long wick on the upper side signifies that when the market opened, buyers were in control of the market which made the price rise, at the highest point of the candle stick, the sellers took over and reduced the market price to a very low level. The candlestick then closed near the opening price which made the body to be so small. To have an accurate shooting star candle stick, the distance between the "highest point" of the candle stick to the "close" of the market should be double the distance of the "close" to the "open".
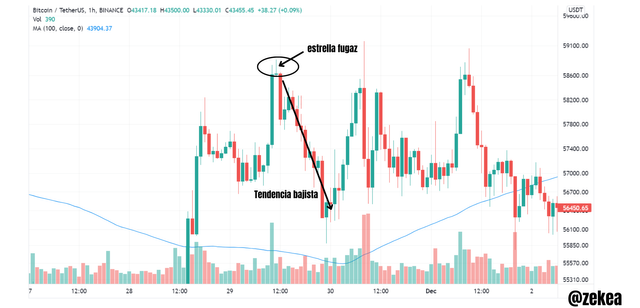
The shooting star candlestick represents a diversion in a bullish trend, which means traders should prepare to sell off their positions. A real life example is below,
Conclusion
No trader just goes into the markets to sell and buy positions without doing thorough analysis. The cryptocurrency markets are very volatile and anyone who does that will end up in pain. Technical and fundamental analysis are very important to avoid or reduce risk of losses.
Researching and analyzing the use case or the health of a crypto currency project helps us to know if it has the capacity or potentials to increase in value later in the future. All analysis on the chart are basically technical analysis and will help us traders identify our entry point and when to take out our profits from the trade.
Combination of these two methods of analysis will make a successful and well informed trader. I'm so much grateful for this lesson, thank you Prof. @pelon53