Steemit Crypto Academy | Season 3: Week 7 || How to create an account on TradingView, how to use indicators,tools, features of tradingview

Hello All,
As-Salaam-Alaikum!
First of all, welcome to my week 7 course today. Today we will read about tradingview website that traders use tradingview website which traders use to view different trading charts.
Traders, whether new or old, use some chart application to make profits from their trade, or to watch market trends. Tradingview is a website or application that is used by almost every trader at the moment.
On this website we can easily access the charts of all stock markets of the world, Exchange cryptocurrency, forex and Gold. You trade online in any market and you have to show the price chart or you have to use different indicators. Or if you want to make videos using indicators on different charts, you can use the tradingview website for this purpose.
On the tradingView website you can see charts of all the markets in the world. For example, you can see the chart about the forex market, Gold and each pair.
Because the trend of online trading is increasing rapidly today, so is the use of trading chart application and website also increasing. Traders use a variety of tools and indicators to estimate market trends. So the tradingview site is used for this purpose.
At the moment steemitcryptoAcademy professors are teaching to use different indicators, so we can use the trading view site to learn these indicators. we can learn practically use of them.
New users understand that tradingView only supports crypto market or pair, but before using it , understand that tradingView supports charts of almost all markets of the world.
Let's learn the basic ways to use of tradingView site.
How to create an account on TradingView
To register an account on TradingView, you have to choose Free Basic plan. As soon as you open the TradingView website, you will find various plans for registration, but for new traders who are just going through the stages of learning, a free basic account is enough. Now to create an account on TradingView, open TradingView site or type TradingView in Google search engine, and first click on result.
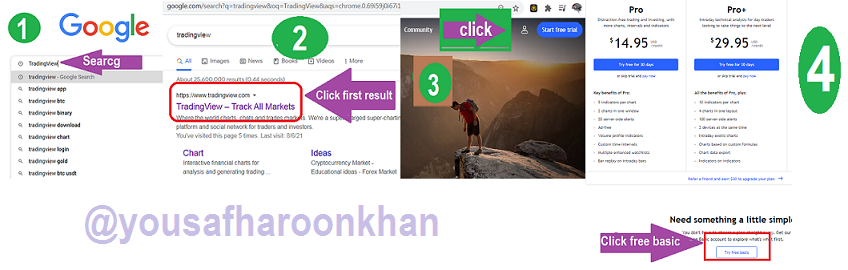
As soon as you click on Try free basic, a new window will open in front of you. You can register your account via Facebook, Twitter and E-mail. I will register here by e-mail. To register via e-mail you click on E-mail and if you want to register in another way then click on this option.
- As soon as you click on e-mail,
- you have to enter e-mail, password
- and you have to Agree on terms and use
- and fill captcha
- and click on create account.

The tradingView system will send you a verification e-mail link to the email you provide. In your inbox,
click on this email link and use the tradingView free basic account.
As soon as you click on the activation link,
then you have to enter your name, profile picture, and complete your profile.
Hopefully by now you understand how to register an account on TradingView site.

Tradingview Features
If we talk about the features of TradingView site, it has many important futures, which traders can use to improve their trade. One of these popular features is Market. We can check the trend of all the financial markets of the world in the market. The most popular of these markets are:
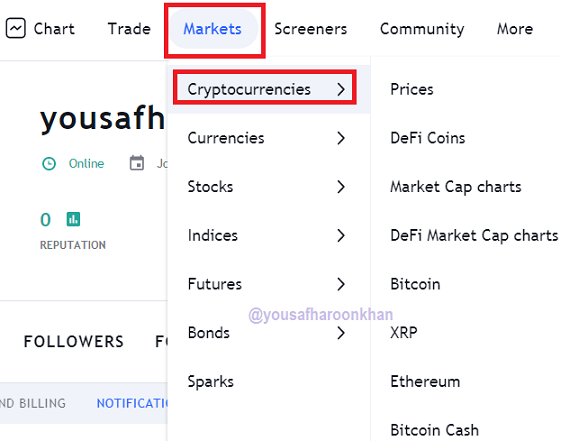
Cryptocurrencies There are live updates on the price of all cryptocurrencies in the market feature. Which coin is being sold at which price, in which exchange, in which pair, at what price. We can see the whole trend view of cryptocurrencies in the feature of market.
In this way in the market we can get information about the trends of major pairs of all the world's currencies which are important in the forex market. in shorts words,Market feature gives us access to all the famous financial markets of the world whether it is Currencies, Stocks market or Indices, Futures and Bonds.
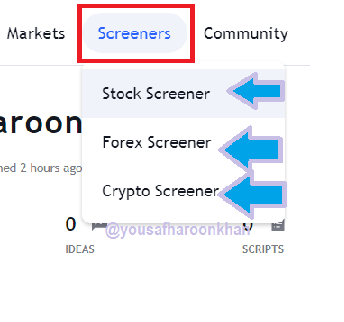
Screener There is a great feature screener that we can use on TradingView and using this feature we can get the best results in a short time through the indicators of our choice. In the screener feature we can use Stock screener, Forex screener and crypto screener. And then we can trade accordingly.
In addition, Trade, Community and Chart are also very important feature. In Trade, we can check which are the Top Brokers in the world and get information about Broker award. In the community feature we can know the lattest opinions of various traders and experts about the trading and we can read the latest trading information. But one of these feature is the feature watchlist. In this watchlist feature, tradingview user can also set his watchlist according to his portfolio.
How to set the chart and use the tools
All features of tradingView are used for trading. There are all sorts of tools and indicators for technical analysis that give traders a huge advantage in trade. Thus the main use of TradingView is Chart.
All features of tradingView are used for trading. There are all sorts of tools and indicators for technical analysis that give traders a huge advantage in trade. Thus the main use of TradingView is Chart. To view the chart on TradingView and to set it, we have to click on the chart.
As soon as we click on the chart, we see a lot of tools on the left side. We can work on the chart with the help of these tools. Suppose we have to draw a circle or an arrow somewhere on the chart and we will do other such things with the help of these tools then there are different types of tools in the tools bar. which we can use according to our need.

Chart Setting
Anyone who works on a chart in tradingView wants the chart to look good and clear, so many new users do not understand how to set the chart,
so the setting of the chart means that how we want to see that like its color bars, body color, Boarders, Wick, so that the viewer can see the information clearly on the chart, so to set the chart we first go to the setting.
The setting option is at the top right. You can see above in the screenshot. When we click on the setting button, we see all the options, such as what is the color of the body, so we can select the color of our choice, etc

In Symbol area, we can add and remove the color of the chart and wick to the candle. In addition, we can ticker the chart symbol in the Status Line, show open market status, OHLC, Bar change value, Buy / sell and add and remove many things in the chart. We can see all these options in the setting.
Example 1

Symbol & Appearance
I have taken a chart of BTC / Usdt pair and you can see that I have added Body, borders, wick and last pric line in it. But if I want the background of this chart to be black and further I want to change the vert and Horz Grid lines then I have to go to Appearnce and I will add all this in the change chart. You can see the difference between the screenshot above and the screenshot below. This way we can easily set the chart to our liking. you can also see my setting of chart in screenshot that i added in the chart body.

You can now see the obvious difference between the two charts. I hope you have understood the chart setting from this practical example.

Use of tools in the Chart
If you click on the chart, on the left side you have various tools for editing inside the chart. This way we can use these tools to draw different lines inside the chart. So the basic tools that users use the most. They are as follows.
The first is the tools cursors with which we drag the chart back and forth. The cursor contains arrow, dot, and eraser.
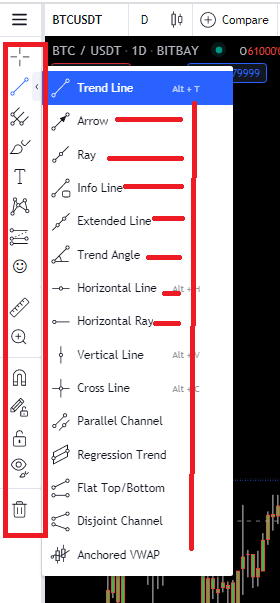
Second is the tools of the trend line and the trend line is used the most, when traders draw different trend lines on the chart during technical analysis.
The trend line tools include Arrow, Ray, info line, trend angle. There are many trend line options that new users can use while editing the chart as per their requirement.
Then there are the different pitch fork tools on the third.
Then we use the text tool if we want to write some text on the chart. There are many more tools that we can use to make the chart more attractive.

Use of indicators & strategies in the Chart
Indicators are the only feature that traders around the world use in charts. And with the help of indicators, traders perform technical analysis of cryptocurrency market and various coins. TradingView allows its user to use various indicators for free.
Tradingview users can use three indicators at a time for free. But I think if you are a new trader then tradingView free account is enough to learn.
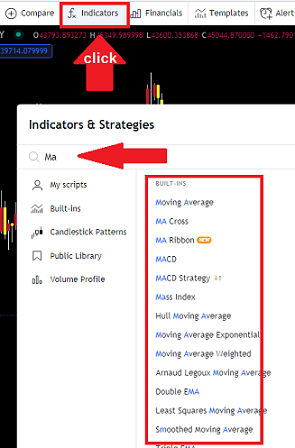
- The indicator option is in the center at the top.
- The fx button is the indicator button.
- To use the indicators, click on fx
- and whatever you want to put in the indicator chart, you can search by typing it in the search bar.
You can see, I have written MA moving average in the search bar, then Moving average indicator below has arrived Once we click on it, it will appear on the MA chart. If you want to add two moving averages, you have to double click on MA.
How to add indicator in chart
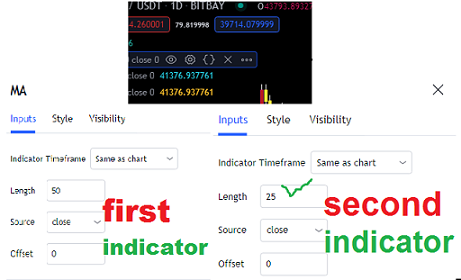
I have added three Moving Average indicators to the chart and I want to see how these three MAs inform me about market trend. The length of one of these three indicators is 50 days, then the other is 25 days and the third is seven days. If seven days MA and twenty five days MA cross the fifty day line to above then also the seven day line cross the 25 day line over it will be a high buy signal. I use three moving averages and I have gained more than 70% accurate profit from it. You can see in the chart how I added three MA indicators to the chart. You can also use these indicators to know the market trend. it is very much easy to use indicators in chart. there are many indicators that will help the new user to learn about , adding the indicator in the different chart.so you can use any chart, if you are trading on forex then search forex chart, so every market chart you can find here .

Conclusion
You can gain up to five years of data on TradingView, which is sometimes required by traders and authors for research. One of the features of this site is that we can see the chart and the fastest latest update of all the financial markets of the world whether it is bonds, stock, forex or crypto market.
On this we can create our account for free and also read and set the chart through basic skills. TradingView is very easy to use and with a little effort we can enhance our trading skills with TradingView.
We can know the ideas of different expert traders and in this way we can be aware of the latest update. In addition, on Tradingview, we can get expert feedback on market trends on a daily basis.
I think if you are a new trader and you don't know the trading view yet, it means you haven't learned the trade yet. So today in my course I have tried to write all the basic things about tradingview here which will be helpful for the new trader.
Homework week-7 :
Question no 1:
Defining the TradingView site and how to register an account in tradingview? what are the different registration plan?(screenshot necessary)
Question no 2:
Explain the different features of tradingView and what is your favorite feature and why?(screenshot necessary)
Question no 3:
How to set up a chart in TradingView and use two tools to edit it.(screenshot necessary)
Question no 4:
Explain how to add indicator in chart, what is your your favorite indicator and why? (screenshot necessary)
Question no 5:
Do you think TradingView is useful in predicting the market for cryptocurrency (trend / price)?
6
Conclusion
Rules
Important All Homework posts should be posted in the community Steemit Crypto Academy .
Your Homework should be at least 300-1000 words.(if any students want to explain more words ,it is allowed)
Add tag #yousafharoonkhan-s3week7 #cryptoacademy in your post and should be among the first five tags. Also, tag me as @yousafharoonkhan
Use only copy-right free images
PLAGIARISM Will not be Accepted, make sure your content in the post is not copied and pasted from other sources.
Plagiarism and spinning of other users’ articles will not be tolerated in the homework task. Otherwise repeat offenders will be blacklisted and banned from the Crypto Academy.
Courses participation time is from 00:00 08-Aug-to 23:59 14-Aug-2021
Users having a reputation of minimum reputation of 55 and at least 250 Steem Power of their own (not delegated to them).
Users who are powering down will not be voted and considered excluded from participation.
- It is necessary to complete all given questions in the week 7 course to gain the full marks.
Thank You.
@yousafharoonkhan
Crypto Professors at Steemit Crypto Academy

https://steemit.com/hive-108451/@haseeb-asif-khan/steemit-crypto-academy-or-season-3-week-7-or-or-how-to-create-an-account-on-tradingview-how-to-use-indicators-tools-features-of
Walekum salam @yousafharoonkhan
Dear brother today your steemit crypto academy posting is so excellent I well participate in this contest
Walekum salam dear sir @yousafharoon,You are giving very good information on Crpto Academy.
Here is My link Professor
A great homework topic, professor.
I am happy to improve myself. Learning is a wonderful blessing Professor,
I have an account suitable for both intermediate and advanced homework. Can I do both your homework and advanced homework?
It is good you are improving ..and yes you can take participate both
Professor you always publish a really very educative and interesting lecture for us . I am proud of you .
Thank you for this wonderful task @ professor.
Hola profesor @yousafharoonkhan disculpe la molestia, le escribo porque publique mi tarea hace 3 días y no ha Sido revisada, estuve viendo que corrigió tareas después de la mía entonces creo que la salto. Espero su respuesta, gracias. adjunto nuevamente el link de la tarea.
https://steemit.com/hive-108451/@annwiswell/crypto-academy-temporada-3-semana-7-publicacion-de-tareas-para-el-profesor-yousafharoonkhan
Hola profesor @yousafharoonkhan . ¿puedo presentar mi tarea en español?. Saludos
Si se puede amigo, saludos
Muchas gracias amigo, saludos
Hola profesor @yousafharoonkhan. Acá le dejo mi tares. Un saludo especial.
https://steemit.com/hive-108451/@perezzambrano/crypto-academy-temporada-3-semana-7-publicacion-de-tareas-para-el-profesor-yousafharoonkhan