Steemit Crypto Academy | Season 3: Week 7 || How to create a TradingView account, how to use TradingView indicators, tools and features. By @fabiha

Assalamoalikum professor, Guys, I am Fine hopefully you all are also fine there is my homework task let's Start.

Homework week-7 :
Question no 1:
Defining the TradingView site and how to register an account in tradingview? what are the different registration plan?(screenshot necessary)
Question no 2:
Explain the different features of tradingView and what is your favorite feature and why?(screenshot necessary)
Question no 3:
How to set up a chart in TradingView and use two tools to edit it. (screenshot necessary)
Question no 4:
Explain how to add indicator in chart, what is your favorite indicator and why? (screenshot necessary)
Question no 5:
Do you think TradingView is useful in predicting the market for cryptocurrency (trend / price)?
Question no 6
Conclusion


The trading view is a cloud-based charting platform and a social trading platform you can load any tradable market in the world from crypto to stocks to forex futures commodities you name it if it can be traded it’s on the trading view Platform.
The trading view is also a social trading platform and that’s because it has social Elements so if I go to ideas here we'll get a list of all the different ideas posted by other traders on the platform. There’s also a script section that lists all the scripts and strategies created by trading views users and over here on the right. There are public chat rooms that you can discuss trading with traders all around the world So it’s kind of like a social media platform a charting platform a scripting platform and a back-testing platform all wrapped up into one service.


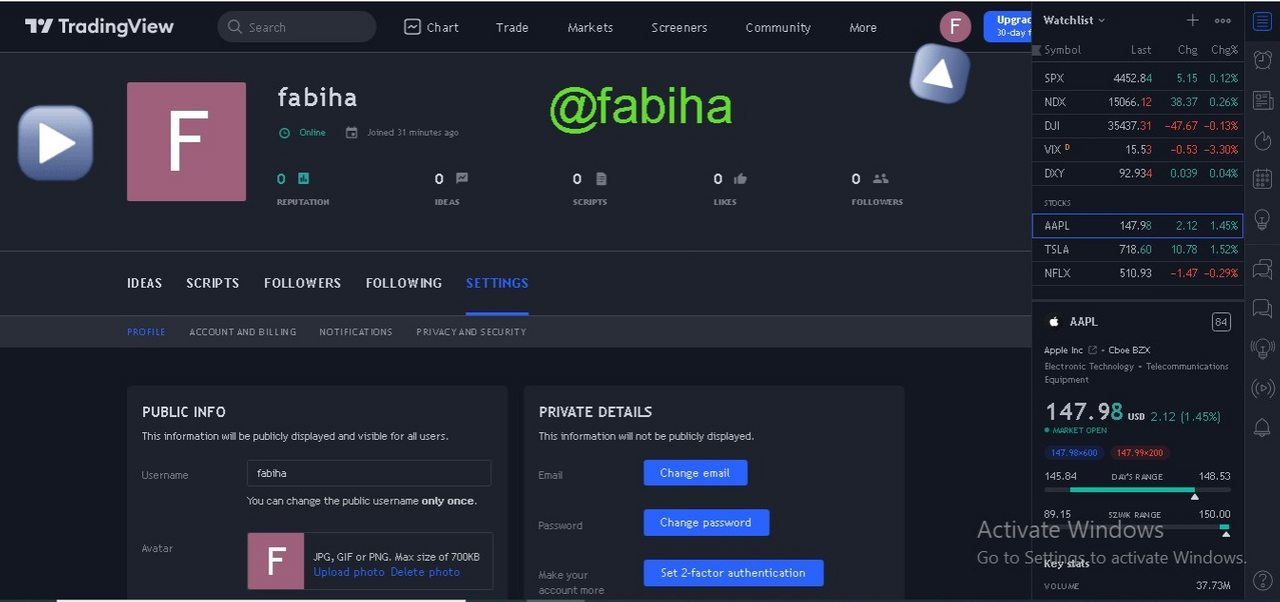
What are the different registration plans?
After Sign up on trading view, After I click on the upgrade now I will see that there is two Form of registration Plan namely monthly or Annually, there are four plans.

- Basic plan
- Pro
- Pro+
- Premium
1) Basic plan
This is the first Plan and Completely free so, It allows limited access and tools. so in this plan, many peoples use because it is free. It allows a total of 3 indicators in a chart.
2) Pro
First, we talk about monthly so, Pro plan Cost is 14.95$ in this plan you will get the benefit that you will have to use 5 indicators on the graph at the same time also ads-free, two charts in one window.
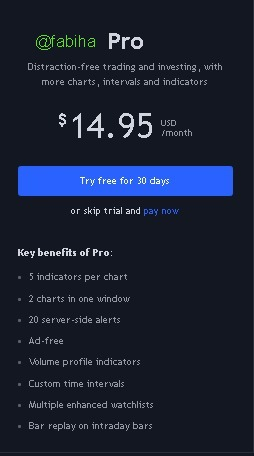
In Annually pro plan Cost is 155$ there also you get the same benefit but also get a benefit that you will save your 24$ a year as shown in the pic:

3) Pro+
This is the third plan. it costs 29.95$ monthly. You can apply 10 indicators on a chart at the same time. It's beneficial to u let's see in the pic

It costs 299$ Annually benefits that you save $60 as a year as shown in the picture.

4) Premium
This is the highest of the four plans it is very expensive it costs 59.95$ monthly. it also offers more features than both plans its main benefit is that we can use 25 indicators in one chart at the same time, 8 charts in one layout, and also 400 server-side alerts as shown in the pic

Annually it costs 599$ and you will save 120$ in a year.

Different features of trading View
The TradingView platform has a ton of different features that help helps in their everyday exchanging exercises I will be taking you some of them:

Chart :

I will click on the chart now, the chart will open as shown in the picture.

A chart tab will open. On the right side of the screen. In the watchlist, you can open any assets of your own choice. i will open BTC/USDT.
there are also more options like indicators. you will choose any indicator you want to choose.
The next feature is a trade.
Trade

In this part, the best agents are positioned by rating. At present, the agent with the most elevated rating is Capital.com with 4.42. Next comes Currency.com. Here, the representative determines the base store and comparable conditions, rules. You can open records with these representatives and learn different exchanging thoughts.
Market
In the Market future, there will be all crypto Currencies, stocks, indices, and many things related to crypto.
- In the market section when you click on the Cryptocurrencies you can get information about different crypto assets.

When clicking on currencies than we can get the following information regarding the available currencies. as shown in the picture


now we are going forward and get a screener as shown in the picture

My favorite feature was the market because in the market we can get all information regarding crypto-assets here we can see the market capitalization, high price, low price as well as volume.
Question no 3:How to set up a chart in TradingView and use two tools to edit it. (screenshot necessary)
Firstly I will Visit tradingview.com
Here click on the chart now chart will be open successfully here is the pic
Symbol Searching Tool
I will Choose pair BTC/USDT by clicking on the symbol search click crypto then search BTC/USDT then it will be selected. as shown in the picture

Time frame tool
now I will change the time frame by clicking here as shown in the picture.

I will change it to Week.
Line Tool
As shown in the picture Here you will see different options Like Candles, bar, the line I will Choose it to line So as An output see on the picture:

there will be also a chart setting as well here i will select appearance or more settings here as Shown in the picture in appearance setting we have changed our background, Scales text, change our top left , Top margin

Firstly to add an indicator I will click on Fx indicators See on the picture.

Here I will Search a Range Filter as Shown in the picture.

Now click on the range filter than We have Successfully Added our indicator as Shown in the picture.

My favorite indicator is the range filter because It gives very good Signals.
In this indicator, you will find the red and green color lines which are very important as shown in the picture
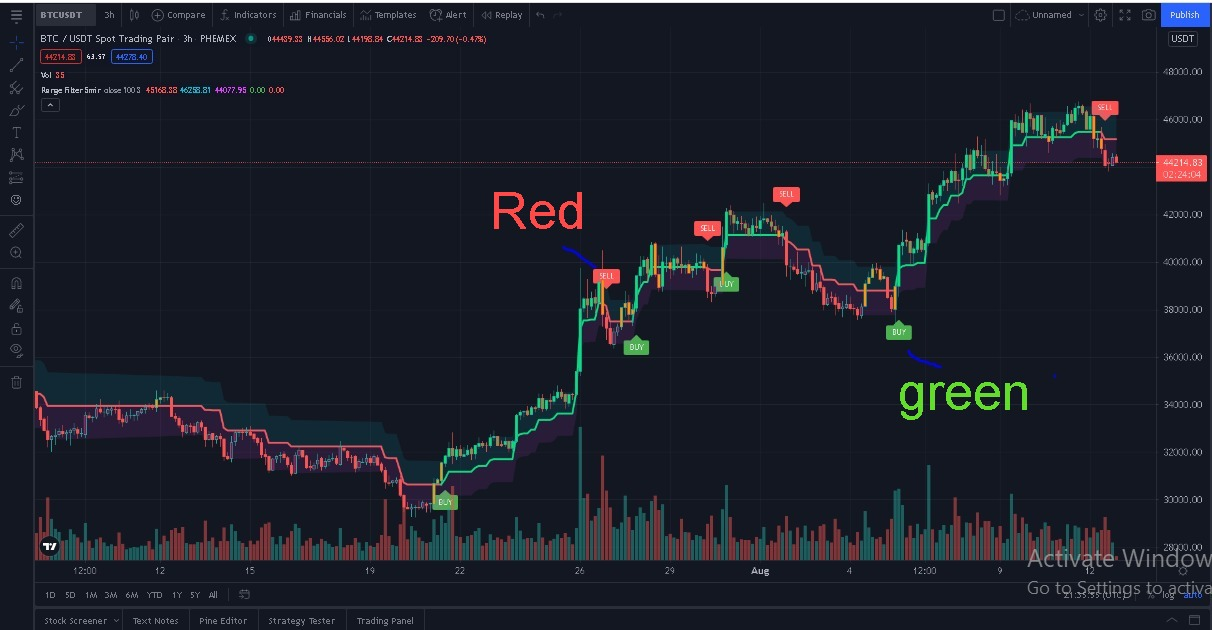
These lines will tell you when the market ups and when the markets down by using these lines you can execute your trade very easily you can execute your first trade when the green line is created and you have to set your stop loss a little below the green line and you have to keep one thing on your mind that your stop loss should not be more than two percent if the candle is stopped and your stop-loss is large than you, you do not trade there when the market creates bullish candles by touching the green line so you can execute the trade by setting your stop loss a little below the candle, the target of profit book when you see burst pattern in the market you don't need to do the market analysis all day You can generate good profit just by using this indicator for two hours a day. It is more important for you to choose the best trading platform for you I will Recommend this Indicator as the best indicator.
Hi @fabiha
Unfortunately, you are not yet eligible to participate in the Intermediate level of the Steemit Crypto Academy because you have less than 255sp.
Homework task - 0
Professor If I POWERING UP my Steem So Can You plz Check My Homework??
@yousafharoonkhan
Error
Congratulations, your post has been upvoted by @Scilwa, which is the curating account for @R2cornell's Discord Community.