Crypto Academy Week 2 Homework| Course 2 by @stream4u | How To Read Candlestick Charts In Different Time Frames & In
Aslam-mu-Alakum!
It is my week 2, course 2 ,home work, that is given by professor @stream4u , i am very much happy and satisfy with the teaching of professor @stream4u , he gave us great knowledge in the class in course 2, so now i am able to write my home work. i tried to get and take information from many source and big source is professor @stream4u teaching and lecture .
How To Read Candlestick Charts In Different Time Frames
The candle stick chart provides a very important information and if we want to do business in any market then it is important for us to have information about this candle stick chart. Because we can get technical analysis through it. You can keep an eye on the price fluctuations and if I say that investors invest only by looking at the candle stick chart. We can also say that this candle stick also helps an investor to know which currency can make a profit or a loss in the future. And based on that, some investors make long term and short term investments.
A candlestick is a type of price chart used in technical analysis that displays the high, low, open, and closing prices of a security for a specific period. It originated from Japanese rice merchants and traders to track market prices and daily momentum hundreds of years before becoming popularized in the United States. The wide part of the candlestick is called the "real body" and tells investors whether the closing price was higher or lower than the opening price (black/red if the stock closed lower, white/green if the stock closed higher).
Candlestick We analyze this with the help of this chart. If there is an increase in the value of a currency, then how long did that increase last and how much time did the investor invest in this period? Is also seen. Because if any investor invests time and money in any business, he also wants to make a profit from it. Therefore, in today's modern era, two types of investments are determined with the help of this candlestick. One is long term and the other is short term business because when investing in long term investors look at the candlestick from the point of view of history. And see if the investment is made for long term, then the candlestick of three years ago and the record of twelve months are also taken into consideration. The open and close, and the lower and higher patterns are closely watched by analysts. This is why candlestick analysis is so important in cryptocurrency trading.
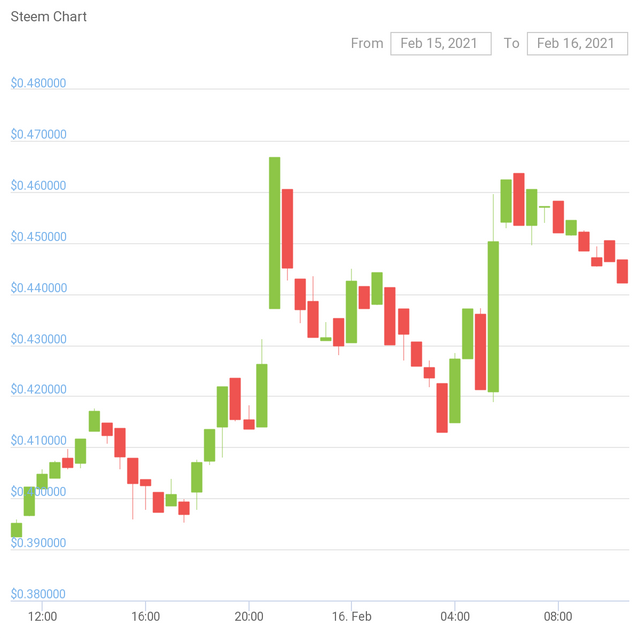
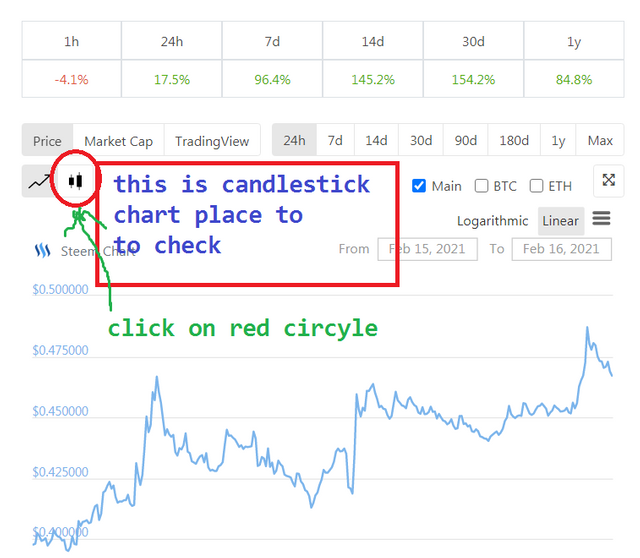
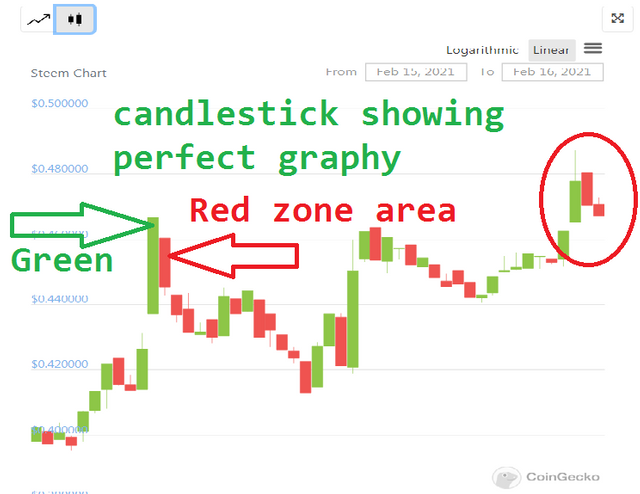
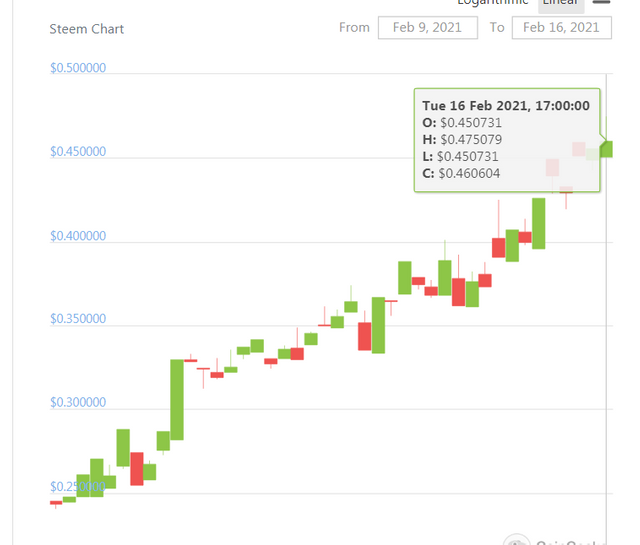
I have taken a steam dollar candle stick chart. We are seeing two types of colors in it which are clearly visible. One is red colored candle and the other is green which means green colored candle. Try zooming in on the candle. In this way we also see what is the continuity of the green candlestick when it comes into being, and if we write in words, the candle indicates when and for how long the price of a coin remained stable. And also the change of colors all these components inform the fluctuations of the market and the trend of interest of investors.
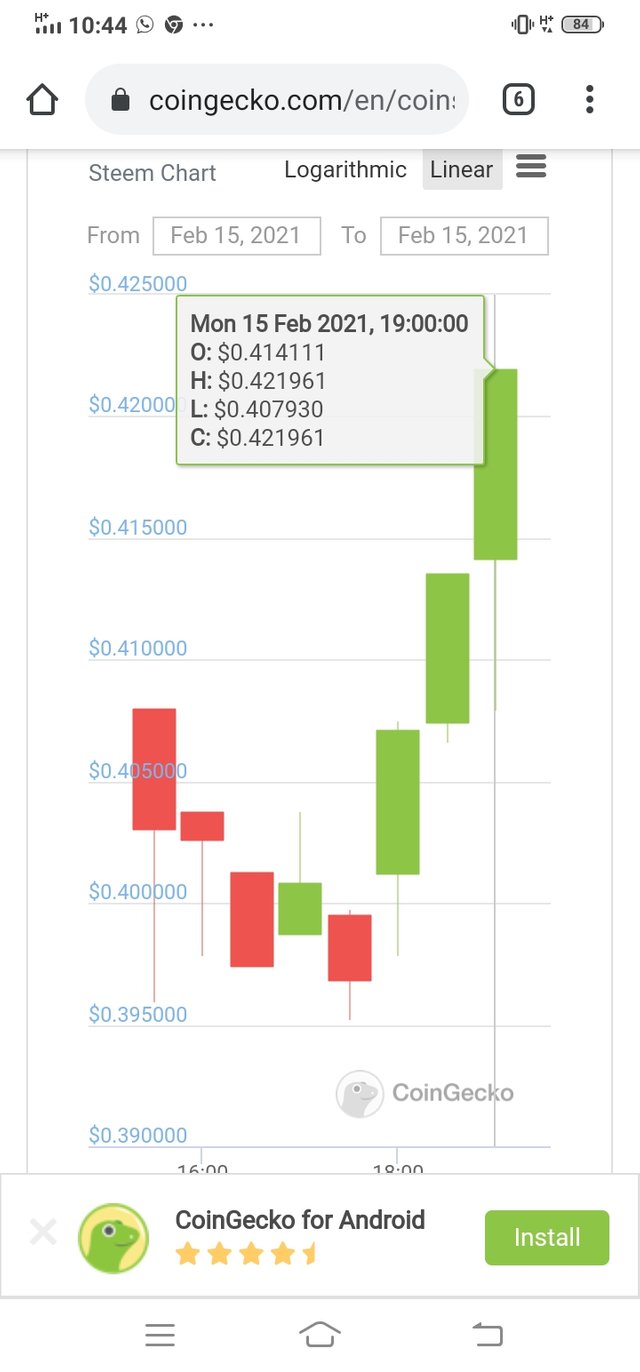
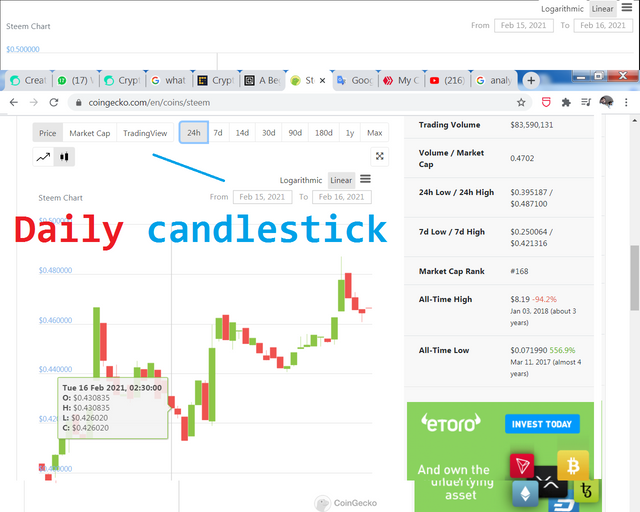
Friends, if you look closely at the screenshot above, you can see the opening and closing of a small candlestick chart inside the rectangle. This is the candle stick chart of 15th February 2021. The letter "O" represents the opening and indicates that today when the trade open of this steem dollar was at 0.41 اور and if in twenty-four hours if this open price changes at any time then this change Because sometimes the candle will go up to the green lahan. In this chart you can see another letter "H". We attribute this letter to High. If the coin price goes above the opening price today, for example if the open price was $ 4 and then during the trade the coin price goes up to $ 6 at any time of the day and then at the end of the day the coin goes above the opening price. When the price goes down, we see open and high. Thus, there is a letter "L" which is low. At the end of the day, we will see the low price of this coin in the category of low candle. In this way, the green opening indicates more or less stability. Thus, the red candlestick indicates less stability.
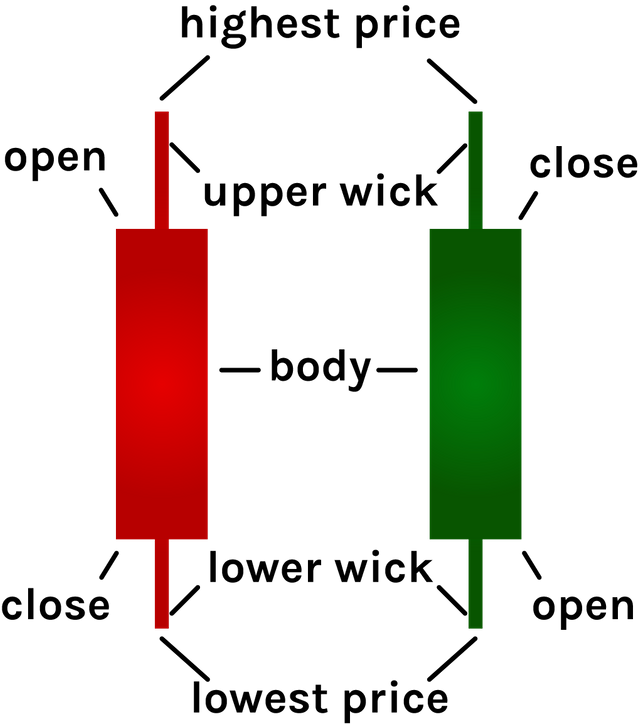
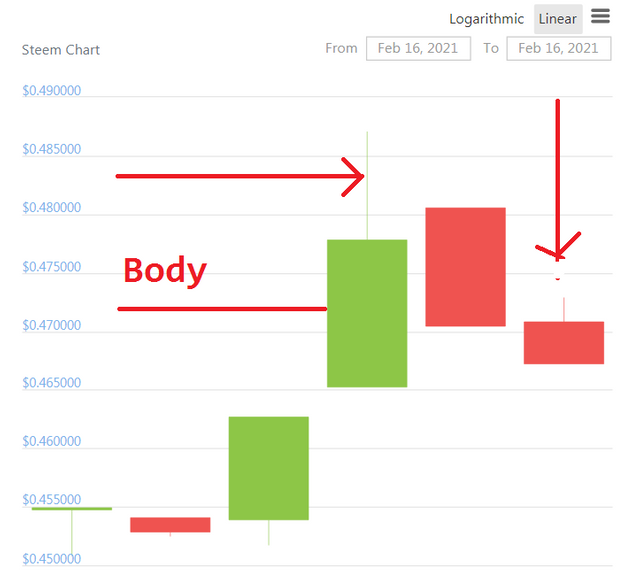
Let's find out the rest of the figure above:
Body: The body indicates the open range to be closed. In other words, it shows the difference between the closing price and the starting price.
Wicks: Also called tails or shadows. Shows the highest and lowest asset prices during the candlestick period. If there is no insurance, the initial and final price is the lowest / highest price.
Highest Price: The upper end of the fuse indicates the highest price agreed upon for the period.
Lowest price: The price traded in the lowest period is shown at the bottom of the lower wick.
Starting price: is the price at which the first trade was made in the new chandelier period. If the price rises, the candle falls, turns green and red.
Closing price: The closing price is the last price agreed during the candlestick making period. If this price exceeds the starting price, the candle will be green, otherwise it will be red.info source
Candlestick Trading Time frame Analysis
there are many time frame candlestick, some are for long term trade analysis , some are daily so here in this area of topic will try to explain about candlestick trading time frame
- Monthly candlestick
- Weekly candlestick
- Daily candlestick
- H4 Candle stick
- H1 candlestick
- M30 candlestick
- M15 candlestick
- M5 candlestick
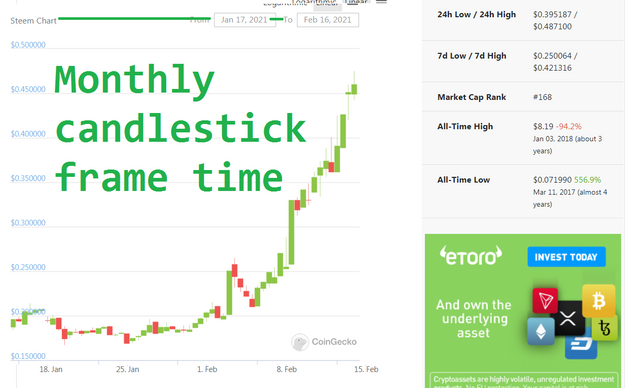
Now I will write the most important part of this homework here is the candlestick trading time frame. So when my classmates were looking at this topic, I became convinced that the time chart is very important in candle stick And we also need expertise in this area because if we want to be a successful trader and master the subject of candlestick, we have to look at all the aspects related to it. I have given you a short stick above but I will tell you about the timeframe which is the time frame and which timeframe vhart is important for us so that we can check it. The main frame is the monthly timeframe and it is also called monthly candlestick. And it covers the whole month. If we talk about the whole year like this, it will be a candlestick tomorrow. And this candlestick is very useful in long term trading and if you want long term trading then this candlestick ship is very important. Also there is a weekly candlestick. And this candle long term and short term. Both traders use it for analysis. Just like monthly has a month's jahzah, we would say it has a jahzah of a week and a day with a week. But a weekly candlestick is more useful for a long term and a month four. This is a number of four every month and 12 * 4 of the year. This is a daily candle. I would like to tell you here that work in the market takes place five days a week and this is an international rule. And work five days a week and trade twenty-four hours a day, five days a week. Then there's the H4 candle. And this one candlestick is very helpful in daily and short term trade. H1 candle. And this too can be a very good trade man in daily trade. Also M30 is a candlestick and it is made on a trade of 30 minutes duration so you can then calculate their number accordingly. Thus in M15 and M30 trade people are doing very good trade. The time trade is five minutes. But you need to be very careful before trading on all those candlesticks that are absolute time, especially the M5 candlestick time frame trade because I have seen a lot of people who are new. They only lose out on this candlestick.
but here i will again repeat my above words that before starting trade or plan always gain more experience, so i will prefer for beginner that they should first start from DAILY CANDLESTICK TRADE THEN THEY CAN MOVE TO M30 TO M15
Daily candlestick chart
check date it is daily whole day you can get anaylasis of the trade so here we can take information about trade ,
WEEKLY CANDLESTICK TIME FRAME
Monthly candlestick frame time
i tried my best to explain the given home work . i am very much satisfied with the lecture of professor @stream4u , here i want to tell you very much honestly that before this lecture i have no idea about candlestick , but i was doing trade and my trade was going in lost, so i made great lost, here i want to tell you and that i had many doge coin, but i sold all on January just in low price, so if i had knowledge of this candlestick , then there was great opportunity to gain profit from my doge coin investment, so here i am very much satisfy with the crypto-academy that they started this course, so i got information, so i studied , then i am able to write this my homework, so i am very much satisfy with the teaching of professor @stream4u thank sir for giving us time, and hope in future we will gain more information and skills from you.
My special Thank to sir, @stream4u and all steemit ,crypto-academy for giving us opportunity to learn about trading, crypto .
special thank to professor: @stream4u,@steemcurator01 and @steemcurator02
Student Name: @yousafharoonkhan
Urudu Version
موم بتی کا اسٹک چارٹ ایک بہت ہی اہم معلومات فراہم کرتا ہے اور اگر ہم کسی بھی مارکیٹ میں کاروبار کرنا چاہتے ہیں تو ہمارے لئے یہ ضروری ہے کہ اس موم بتی اسٹک چارٹ کے بارے میں معلومات ہوں۔ کیونکہ ہم اس کے ذریعے تکنیکی تجزیہ کرسکتے ہیں۔ آپ قیمتوں کے اتار چڑھاؤ پر نظر رکھ سکتے ہیں اور اگر میں یہ کہتا ہوں کہ سرمایہ کار صرف موم بتی اسٹک چارٹ کو دیکھ کر ہی سرمایہ کاری کرتے ہیں۔ ہم یہ بھی کہہ سکتے ہیں کہ یہ موم بتی کی چھڑی ایک سرمایہ کار کو یہ جاننے میں بھی مدد کرتی ہے کہ مستقبل میں کون سی کرنسی نفع یا نقصان پہنچا سکتی ہے۔ اور اس کی بنیاد پر ، کچھ سرمایہ کار طویل مدتی اور قلیل مدتی سرمایہ کاری کرتے ہیں۔
موم بتی ایک قسم کا قیمت چارٹ ہے جو تکنیکی تجزیہ میں استعمال ہوتا ہے جو ایک خاص مدت کے لئے سیکیورٹی کی اونچی ، کم ، کھلی اور بند قیمتوں کو ظاہر کرتا ہے۔ اس کی ابتدا جاپانی چاول کے تاجروں اور تاجروں سے ہوئی ہے جو امریکہ میں مقبول ہونے سے پہلے سیکڑوں سال قبل مارکیٹ کی قیمتوں اور روزانہ کی رفتار کو ٹریک کرتے ہیں۔ موم بتی کے وسیع حصے کو "اصلی جسم" کہا جاتا ہے اور وہ سرمایہ کاروں کو بتاتا ہے کہ بند ہونے کی قیمت افتتاحی قیمت سے زیادہ یا کم تھی (اگر اسٹاک زیادہ بند ہوا تو سیاہ / سرخ ، اگر اسٹاک زیادہ بند ہوا تو)۔
کینڈلسٹک ہم اس چارٹ کی مدد سے اس کا تجزیہ کرتے ہیں۔ اگر کسی کرنسی کی قیمت میں کوئی اضافہ ہو رہا ہے تو پھر یہ مدت کتنی دیر تک بڑھی اور اس مدت میں سرمایہ کار نے کتنا وقت لگا؟ دیکھا بھی جاتا ہے۔ کیونکہ اگر کوئی سرمایہ کار کسی بھی کاروبار میں وقت اور رقم کی سرمایہ کاری کرتا ہے تو وہ بھی اس سے نفع کمانا چاہتا ہے۔ لہذا ، آج کے جدید دور میں ، اس موم بتی کی مدد سے دو قسم کی سرمایہ کاری کا تعین کیا جاتا ہے۔ ایک طویل مدتی اور دوسرا قلیل مدتی کاروبار ہے کیونکہ جب طویل مدتی سرمایہ کار سرمایہ کاری کرتے ہیں تو تاریخ کے نقطہ نظر سے شمع کی روشنی کو دیکھتے ہیں۔ اور دیکھیں کہ کیا یہ سرمایہ کاری طویل مدتی کے لئے کی گئی ہے ، پھر تین سال پہلے کی موم بتی اور بارہ ماہ کے ریکارڈ کو بھی مدنظر رکھا گیا ہے۔ کھلے اور قریب ، اور نچلے اور اعلی نمونوں کو تجزیہ کاروں نے قریب سے دیکھا ہے۔ یہی وجہ ہے کہ کریڈٹورکینسی ٹریڈنگ میں موم بتی کا تجزیہ اتنا اہم ہے۔
میں نے بھاپ ڈالر کی موم بتی اسٹک چارٹ لیا ہے۔ ہم اس میں دو طرح کے رنگ دیکھ رہے ہیں جو واضح طور پر دکھائی دیتے ہیں۔ ایک سرخ رنگ کی موم بتی ہے اور دوسرا سبز ہے جس کا مطلب ہے سبز رنگ کی موم بتی ہے۔ موم بتی پر زوم لگانے کی کوشش کریں۔ اس طرح ہم یہ بھی دیکھتے ہیں کہ جب سبز شمع روشنی کی تشکیل ہوتی ہے تو اس کا تسلسل کیا ہوتا ہے ، اور اگر ہم الفاظ میں لکھتے ہیں تو موم بتی اس بات کی نشاندہی کرتی ہے کہ سکے کی قیمت کب اور کب تک مستحکم رہی۔ اور رنگوں کی تبدیلی بھی ان تمام اجزاء کو مارکیٹ کے اتار چڑھاو اور سرمایہ کاروں کی دلچسپی کے رجحان سے آگاہ کرتی ہے۔
<سینٹر>
!
دوستو ، اگر آپ مذکورہ اسکرین شاٹ کو قریب سے دیکھیں تو آپ مستطیل کے اندر ایک چھوٹے سے شمع روشنی کے چارٹ کی افتتاحی اور اختتامی شکل دیکھ سکتے ہیں۔ یہ 15 فروری 2021 کا موم بتی اسٹک چارٹ ہے۔ خط "O" اس افتتاحی نمائندگی کرتا ہے اور اس بات کی نشاندہی کرتا ہے کہ آج جب اس اسٹیم ڈالر کی تجارت 0.41 فیصد پر تھی اور اگر چوبیس گھنٹوں میں اگر یہ کھلی قیمت کسی بھی وقت تبدیل ہوتی ہے تو پھر یہ تبدیلی کیونکہ کبھی کبھی موم بتی سبز لہان تک چلی جاتی ہے۔ اس چارٹ میں آپ ایک اور حرف "H" دیکھ سکتے ہیں۔ ہم اس خط کو اعلی سے منسوب کرتے ہیں۔ اگر آج سکے کی قیمت افتتاحی قیمت سے بالاتر ہے ، مثال کے طور پر اگر کھلی قیمت $ 4 تھی اور پھر تجارت کے دوران سکے کی قیمت دن کے کسی بھی وقت $ 6 تک جاتی ہے اور پھر دن کے آخر میں سکے جاتے ہیں افتتاحی قیمت سے اوپر جب قیمت کم ہوجاتی ہے ، تو ہم کھلا اور بلند تر نظر آتے ہیں۔ اس طرح ، ایک خط "L" ہے جو کم ہے۔ دن کے اختتام پر ، ہم اس سکے کی کم قیمت موم بتی کے زمرے میں دیکھیں گے۔ اس طرح ، سبز افتتاحی زیادہ سے زیادہ استحکام کی نشاندہی کرتی ہے۔ اس طرح ، سرخ موم بتی کم استحکام کی نشاندہی کرتی ہے۔
<سینٹر>
!
آئیے مندرجہ بالا باقی اعداد و شمار کا پتہ لگائیں:
جسم: جسم بند ہونے کی کھلی رینج کی طرف اشارہ کرتا ہے۔ دوسرے الفاظ میں ، یہ بند ہونے والی قیمت اور شروعاتی قیمت کے درمیان فرق ظاہر کرتا ہے۔
وِکس: دم یا سائے بھی کہا جاتا ہے۔ موم بتی کی مدت کے دوران اثاثوں کی سب سے زیادہ اور کم قیمت دکھاتا ہے۔ اگر انشورنس نہیں ہے تو ، ابتدائی اور آخری قیمت سب سے کم / سب سے زیادہ قیمت ہے۔
سب سے زیادہ قیمت: فیوز کا اوپری آخر اس مدت کے لئے سب سے زیادہ قیمت پر اتفاق کرتا ہے۔
سب سے کم قیمت: کم قیمت میں ٹریڈ کی جانے والی قیمت نچلے وک کے نچلے حصے میں دکھائی دیتی ہے۔
شروعات کی قیمت: وہ قیمت ہے جس پر نئے فانوس مدت میں پہلی تجارت کی گئی تھی۔ اگر قیمت بڑھتی ہے تو ، موم بتی گر جاتی ہے ، سبز اور سرخ ہو جاتی ہے۔
اختتامی قیمت: اختتامی قیمت موم بتی کے بنانے کے دورانیے کے دوران متفق آخری قیمت ہے۔ اگر یہ پرک
شروعات کی قیمت: وہ قیمت ہے جس پر نئے فانوس مدت میں پہلی تجارت کی گئی تھی۔ اگر قیمت بڑھتی ہے تو ، موم بتی گر جاتی ہے ، سبز اور سرخ ہو جاتی ہے۔
اختتامی قیمت: اختتامی قیمت موم بتی کے بنانے کے دورانیے کے دوران متفق آخری قیمت ہے۔ اگر یہ قیمت شروعاتی قیمت سے زیادہ ہے تو ، موم بتی سبز ہو جائے گی ، ورنہ یہ red.info کا منبع ہوگا
کینڈلسٹک ٹریڈنگ ٹائم فریم تجزیہ
بہت سے ٹائم فریم موم بتی ہیں ، کچھ طویل مدتی تجارتی تجزیہ کے ل are ہیں ، کچھ روزانہ ہیں تو یہاں موضوع کے اس شعبے میں موم بتی کے ٹریڈنگ ٹائم فریم کے بارے میں وضاحت کرنے کی کوشش کریں گے۔
ماہانہ شمع روشنی
ہفتہ وار شمع روشنی
ڈیلی موم بتی
H4 موم بتی کی چھڑی
H1 موم بتی
M30 موم بتی
ایم 15 موم بتی
ایم 5 موم بتی
اب میں اس ہوم ورک کا سب سے اہم حص writeہ یہاں لکھوں گا موم بتی کی تجارت کا ٹائم فریم۔ لہذا جب میرے ہم جماعت اس موضوع کو دیکھ رہے تھے ، مجھے یقین ہوگیا کہ موم بتی کی چھڑی میں ٹائم چارٹ بہت اہم ہے اور ہمیں اس شعبے میں بھی مہارت کی ضرورت ہے کیونکہ اگر ہم ایک کامیاب تاجر بننا چاہتے ہیں اور موم بتی کے مضمون میں مہارت حاصل کرنا چاہتے ہیں تو ، ہمیں اس سے متعلق تمام پہلوؤں کو دیکھو۔ میں نے آپ کو اوپر ایک چھوڑی اسٹک دی ہے لیکن میں آپ کو اس ٹائم فریم کے بارے میں بتاؤں گا جو ٹائم فریم ہے اور ہمارے لئے کون سا ٹائم فریم ورٹ ضروری ہے تاکہ ہم اسے چیک کرسکیں۔ مرکزی فریم ماہانہ ٹائم فریم ہے اور اسے ماہانہ موم بتی بھی کہا جاتا ہے۔ اور یہ پورے مہینے کا احاطہ کرتا ہے۔ اگر ہم اس طرح پورے سال کے بارے میں بات کریں تو یہ کل ایک موم بتی ہوگی۔ اور یہ موم بتی طویل مدتی ٹریڈنگ میں بہت مفید ہے اور اگر آپ طویل مدتی ٹریڈنگ چاہتے ہیں تو یہ موم بتی جہاز بہت ضروری ہے۔ اس کے علاوہ ایک ہفتہ وار شمع بھی ہے۔ اور یہ موم بتی طویل مدتی اور قلیل مدتی ہے۔ دونوں تاجر تجزیہ کے ل. اس کا استعمال کرتے ہیں۔ بالکل اسی طرح جیسے ماہانہ میں ایک مہینہ کا جازہ ہوتا ہے ، ہم یہ کہیں گے کہ اس میں ایک ہفتہ اور ایک دن کے ساتھ ایک دن کا جہہ ہے۔ لیکن ایک ہفتہ وار شمع روشنی طویل مدتی اور ایک ماہ چار کے لئے زیادہ کارآمد ہے۔ یہ ہر مہینے میں چار کی تعداد ہے اور سال کے 12 * 4 ہیں۔ یہ روزانہ موم بتی ہے۔ میں یہاں آپ کو بتانا چاہتا ہوں کہ مارکیٹ میں کام ہفتے میں پانچ دن ہوتا ہے اور یہ ایک بین الاقوامی اصول ہے۔ اور ہفتے میں پانچ دن کام کریں اور دن میں چوبیس گھنٹے ، ہفتے میں پانچ دن تجارت کریں۔ پھر H4 موم بتی ہے. اور یہ ایک شمع روشنی روزانہ اور قلیل مدتی تجارت میں بہت مددگار ہے۔ H1 موم بتی۔ اور یہ بھی روز مرہ کی تجارت میں بہت اچھا تجارتی آدمی ہوسکتا ہے۔ نیز ایم 30 ایک موم بتی ہے اور یہ 30 منٹ کی مدت کی تجارت پر بنایا گیا ہے تاکہ آپ اس کے مطابق ان کی تعداد کا حساب لگاسکیں۔ اس طرح M15 اور M30 ٹریڈ میں لوگ بہت اچھی تجارت کر رہے ہیں۔ وقت تجارت پانچ منٹ ہے۔ لیکن آپ کو ان تمام شمع دانوں پر تجارت کرنے سے پہلے بہت محتاط رہنے کی ضرورت ہے جو مطلق وقت ہیں ، خاص طور پر M5 موم بتی کا ٹائم فریم تجارت کیونکہ میں نے بہت سارے لوگوں کو دیکھا ہے جو نئے ہیں۔ وہ صرف اس موم بتی سے ہار جاتے ہیں۔
لیکن یہاں میں اپنے مذکورہ الفاظ کو ایک بار پھر دہراتا ہوں کہ تجارت شروع کرنے سے پہلے یا منصوبہ بندی سے ہمیشہ زیادہ تجربہ حاصل ہوتا ہے ، لہذا میں ابتدائیہ کے لئے ترجیح دوں گا کہ وہ پہلے ڈیلی کینڈلسٹک تجارت سے شروع کریں جب وہ M30 سے M15 میں منتقل کرسکتے ہیں۔
ڈیلی موم بتی کا چارٹ
چیک دن یہ ہے کہ یہ سارا دن روزانہ ہوتا ہے آپ کو تجارت کی انیلیسس مل سکتی ہے لہذا ہم یہاں تجارت کے بارے میں معلومات لے سکتے ہیں۔
ہفتے کے آخر میں کینڈلیسٹک ٹائم فریم
ماہانہ موم بتی کے فریم کا وقت
میں نے دیئے گئے گھر کے کام کی وضاحت کرنے کی پوری کوشش کی۔ میں پروفیسر @ اسٹریم 4 کے لیکچر سے بہت مطمئن ہوں ، یہاں میں آپ کو بہت ایمانداری کے ساتھ بتانا چاہتا ہوں کہ اس لیکچر سے پہلے مجھے موم بتی کے بارے میں کوئی اندازہ نہیں ہے ، لیکن میں تجارت کر رہا تھا اور میری تجارت ختم ہو رہی تھی ، اس لئے میں نے بہت اچھا بنایا کھو گیا ، میں یہاں آپ کو بتانا چاہتا ہوں اور یہ کہ میرے پاس بہت سے ڈوئگ سکے تھے ، لیکن میں نے جنوری کو صرف کم قیمت میں بیچا ، لہذا اگر مجھے اس شمع کی روشنی کا علم ہوتا تو پھر میرے ڈوج سکے کی سرمایہ کاری سے نفع حاصل کرنے کا بہت بڑا موقع ملا ، تو یہاں میں کرپٹو اکیڈمی سے بہت مطمئن ہوں کہ انہوں نے یہ کورس شروع کیا ، لہذا مجھے معلومات ملی ، لہذا میں نے تعلیم حاصل کی ، پھر میں یہ اپنا ہوم ورک لکھنے کے قابل ہوں ، لہذا میں پروفیسر @ اسٹری4u کی تعلیم سے بہت مطمئن ہوں۔ ہمیں وقت دینے پر جناب کا شکریہ ، اور امید ہے کہ آئندہ بھی ہم آپ سے مزید معلومات اور مہارت حاصل کریں گے۔
میرے خصوصی ، جناب ، اسٹریم 4 یو اور تمام اسٹیمیٹ ، کرپٹو اکیڈمی کا شکریہ جس نے ہمیں تجارت ، کریپٹو کے بارے میں جاننے کا موقع فراہم کیا۔
پروفیسر کا خصوصی شکریہ: @ اسٹریم 4u ، @ اسٹیمکیوٹر01 اور @ اسٹیمکیوٹر02
طالب علم کا نام:yousafharoonkhan
My special Thank to sir, @stream4u and all steemit ,crypto-academy for giving us opportunity to learn about trading, crypto .
special thank to professor: @stream4u,@steemcurator01 and @steemcurator02
Student Name: @yousafharoonkhan
Hi @yousafharoonkhan
This is a good suggestion as a beginner it will be difficult for them to work on minute 30 To minute 15, so good to work on the daily candle as it is slow but safe.
Thank You For Showing Your Intrest in Steemit Crypto Academy
You have completed the homework task and made a good post, explained very nicely about How To Read Candlestick Charts In Different Time Frame & Information about Buy-Sell(Support & Resistance).
Remark: Homework Task Completed.
Thank You.
@stream4u
Crypto Professors : Steemit Crypto Academy
#india #affable
yes sir, M5,M15,M30 AND I FEEL ALSO H5 are not for starter learner trader , and best is for them daily candlestick that can keep them safe, so thank sir for appreciation . i am learning very much from this program and your lesson also was very much helpful so thank respected honorable sir @stream4u
Hello! 🙂 I would like to introduce you to something! It’s kinda difficult to sail in the crypto world nowadays, with all the scams and fake info around, with unsecure data and unreliable facts.
Would you like to learn more about Blockchain or to better understand Bitcoin? Or just to upgrade your knowledge with fresh blog topics and with instant help from our experts? You can ask them anything related to cryptocurrency and be sure you will get a fast, reliable, and correct answer!
Register today for FREE at https://blocksafecrypto.com/private-registration/ and solve all the insecurities by chatting with our advisors, or read interesting and current news in our professional blog articles.
Looking forward to seeing you as a new member today!