Steemit Crypto Academy | week 2 by professor @stream4u - How To Read Candlestick Charts In Different Time Frame & Information about Buy-Sell(Support & Resistance).
In trading, time is a very important resource and a lot keeps going on whereby the crypto prices keep changing in the crypto market every other time for example in 1 minute, 5, 15, 30, 45, 1 hour, week, month, and a year. It’s therefore important to understand and appreciate these various time frames before considering to trade.
You must choose the timeframe you are going to be relying on to place your trades, depending on the type of trader you are. The following are the different types of traders, so which one are you or you want to be?
A Scalper
These are short term traders who place trades in short time frames. They like taking advantage of the quick price movements make profits and close their trades immediately. However, these are oftentimes affected by the spikes in the market. When a spike happens it goes in their favour then they make tones of profits depending on the lot size used.
When I was starting out with trading I began with a scalping style of trading. There are plenty of scalping strategies that scalpers use in order to identify good buying and selling signals.
The maximum trading time frame for a scalper is usually 1 hour. Scalpers get their general trend of the market from the 1 hour time frame and then go down to as low as 5minutes to look for good trade entry positions.
Day trader (Intra trader)
These are also called Intra traders. They place and hold their trade positions for a day or a couple of days before they can close their trade positions in either profits or losses. They establish their major market trend based on the weekly time frame. The minimum time frame they can opt to look at is the 4 hourly timeframe as they design and keep track of their crypto trading analysis. Otherwise, Intra traders always keep their focus on the price action (Candlestick patterns) in the 4 hourly, Day and at maximum, the entire week.
Longterm traders (Swing traders)
These can also be termed as Swing traders. These place and hold their trade positions for a very long time. For example; they hold trades for weeks, months and years. They focus on the major yearly trend of the market and go as low as the weekly timeframe as they use the multi-timeframe technical trading analysis to analyze and predict the future market movements. Designed by me using powerpoint
screenshot is taken from my MT5 trading application.
screenshot is taken from my MT5 trading application.
screenshot is taken from my MT5 trading application.
Cc
@stream4u
These are usually big investors, the so-called whales. Long term trading usually requires huge amounts of investments in order to engage in it profitably.
Reading Candlestick charts in the different timeframes
Candlestics are very good indicators used by most traders in determining and predicting the future price action. These are basically used for price action. One of my trading tutors once told me that “by just knowing candlesticks, it’s enough for him to trade and make profits from his daily trading business” Anyway to some extent he was right with that statement. The point here is that candlesticks really tell so much about what’s really happening in the market.
All other indicators that many developers have designed, read off their data from the candlesticks. Therefore candlestick patterns are one of the major leading indicators in the trading business field. You can surely rely on the candlesticks alone in making your daily trade decisions and end up making tones of profits.
However, it’s advisable not to trade candlesticks in isolation. We need to combine them with other trading tools and strategies in order to build a more professional trading style which can consistently yield us good returns on our investment.
There are two major candles used in trading.
The bullish and the bearish candles
Each of these candles has an open, high and closing price plus a wick. The bullish candle is usually denotated as a green coloured candle however traders can always customize it to appear in any colour they want. In the bullish candle, the price opens downwards and closes upwards. It is also characterized by a high price and a low price.
On the other hand, the bearish candle is by default/commonly denoted as a red candle. This candle opens at the upper side of the candle and closes at the lower side of the candle. It is also characterized by a high price and lower price.
Let’s take a look at this Illustration
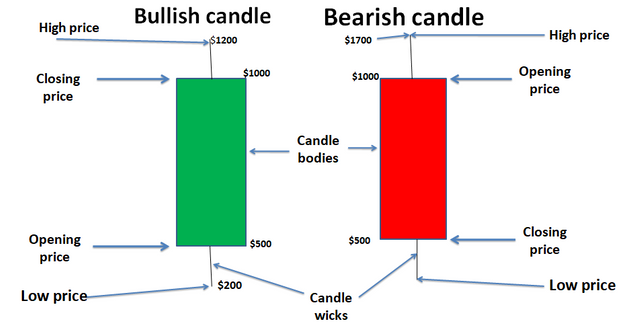
The Bullish and Bearish candle
In the image shown above, the bullish candle opened at $500, the bulls pumped the price to as high as $1200, the price was then rejected at that high and eventually closed at $1000. In trading, the closing price of a bullish candle is an opening price for the bearish candle. The price opened up at $1000, the bulls first tried to pump the price as high as $1700, unfortunately, the bears took over and dumped the price back down to as low as $150. The price was rejected at that lower price and eventually, the candle closed at $500.
Support and Resistance
In trading, there is a fundamental rule that is to do with support and resistance. “We buy at support and sell at resistance.” This should be your song always while dealing with the crypto trading arena. As a trader, when you approach any market, the first thing you need to establish on your trading chart is the support and Resistance zones because these guide you in identifying good entry points for the sell and Buy positions.
Let’s take a look at the BTC/USD trading pair on a weekly chart
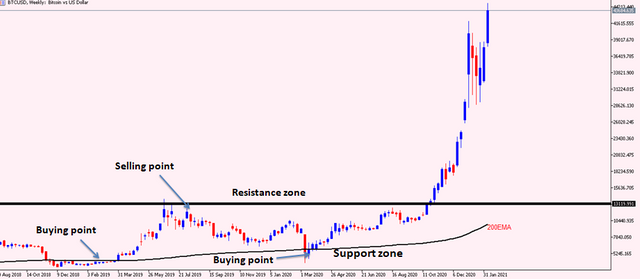
In the illustration above, I used the exponential 200 days moving average to establish my support zone. I also plotted the resistance zone using a horizontal trendline. I have indicated the good buying points and Selling points in that market courtesy of the guidance of my own established support and resistance zones.
How to Interpret the market behaviour using the Candles in the different timeframes.
Here is a 4 hourly Chart for BTCUSD
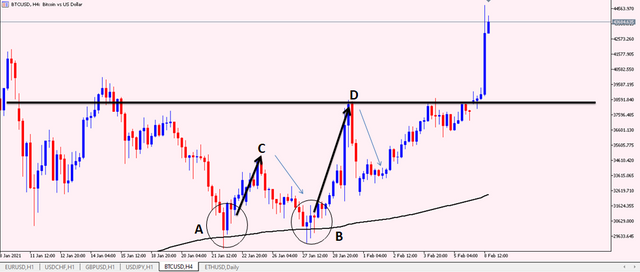
Point A is a good buying point. Question, why is it so? The market is in a strong support zone. The second reason is that there is a bullish engulfing candlestick pattern formed in that circled area at point A, which signals us that the price is taking the upward direction.
The bulls indeed pushed the price as high as point C. At C, we have to jump out and collect our profits, we do not want the price to go back down and affect our profits negatively.
However, Point C is also a good entry selling position. Using the Resistance zone trading knowledge rule, you can realize that this is a good selling position so you enter your sell and scoop your profits as you see the market prices crushing back down to Point B. Those who had sold at point C, they have to jump out at point B. Point B is also another great buying position because of our support zone trading knowledge rule of buying at support, we opt to jump in with a buy and gain profits as the market makes its way up.
ETHUSD trading pair on an hourly Chart
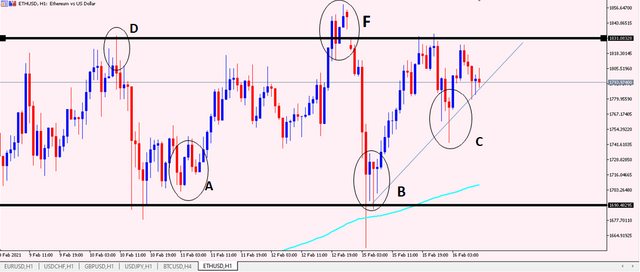
Points A,B and C are good buying positions. Point B most especially, we see long wicks signifying to us strong price rejection of lower prices in that zone. Another reason can also be that this is a strong support zone and that’s why the price is just bouncing off that strong support line and it's so likely to head upwards.
D and F are our selling opportunities, using our trading analysis and tools, we can jump in with a sell and collect some good profits. Why? It’s at the resistance zone. The second reason, higher prices have been strongly rejected. The third reason is that an inverted hammer has been formed which is a good indicator and pointer to a selling decision.
Shared on Twitter
Hi @yohan2on
Thank You For Showing Your Intrest in Steemit Crypto Academy
You have completed the homework task and made a good post, explained very nicely about How To Read Candlestick Charts In Different Time Frame & Information about Buy-Sell(Support & Resistance).
Remark: Homework Task Completed.
Thank You.
@stream4u
Crypto Professors : Steemit Crypto Academy
#india #affable
I am glad you liked it. Thanks so much for the lecture and for such an educational homework task.