Understanding Trends-Crypto Academy / S5W1- Homework Post for @reminiscence01
Hello guys, I welcome you all to this very season-5 of SteemitCryptoAcademy. My pleasure as I participate in the Beginners level course presented by Prof @reminiscence01 on Understanding Trends. Let's get started...

Question 1
a) What do you understand by a Trending market?
b) What is a bullish and a bearish trend? (screenshot required)
Trending Market
Each time we mention the term Trending Market, what comes to our mind should be a representation of buy and sell activities of an underlying asset in form of chart analysis. This scenario entails that there are demand and supply pools that are represented on price movements/Action. This price action is greatly dependent on either the buying pressure or Selling pressures of investors in a trade over a given period.
When we have more buying pressure than selling pressure, price movement is observed to go up and whereas where we have more selling pressure than buying pressure in a given trade, price action is expected to go down. But there are cases where we also see price action bouncing on and off resistance and support levels, in this case, trends are ranging. There is relatively low market volatility in this scenario unlike situations with more buying and selling pressures which are accompanied by high price volatility.
Bullish Market Trend
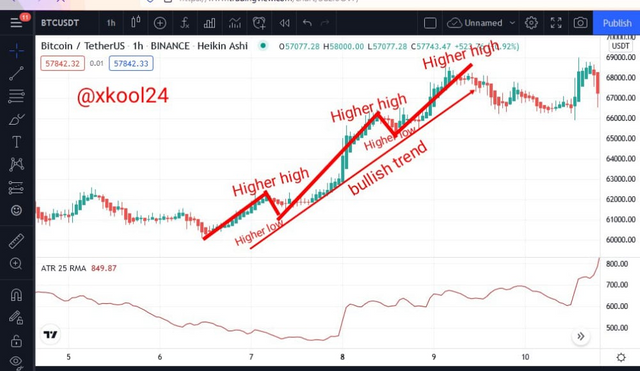
Just as I slightly mentioned, every investor that engages in HODL would want to see this scenario which is an increase in the prices of a given asset. In the Bullish Trend, we are primarily noticing an upward movement is a clear indication that there are more buying activities ongoing than selling off. As traders/Investors keep acquiring more than the given asset, demand is expected to outweigh Supplies and hence the Bullish Trend.
(Screenshot from Tradingview site)
This also means from any chart analysis with an uptrend or bullish trend, we should be expecting Higher Highs and Higher Lows in its trend. The trend may continue like this so far the current low is not lower than the previous low.
Bearish Market Trend
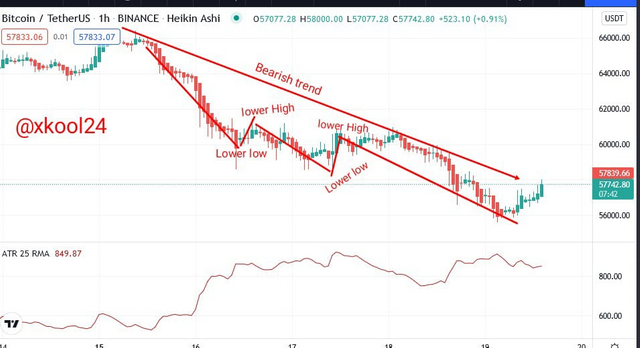
Just like as explained above for the Bullist trend., some categories of investors are also happy with this particular scenario as they await to make some entry positions when the prices of a given asset are down. In this scenario we have more selling activities than buying activities, hence the downward trend observed. Therefore a typical chart analysis would come with price trends making Lower lows and Lower Highs in its proceedings. Each of the previous lows is above the current low levels attained by price action.
(Screenshot from Tradingview site)
Question 2
Explain the following trend identification and give an example of each of them. (Original screenshot needed from your chart). Do this for a bullish and a bearish trend.
i) Market Structure.
ii) Trendlines
Typically, a market structure is a representation of market behavior at any given time. It allows traders or investors to know the actual state of the trade before making any trade position. An investor or trader who understands this should be able to know when the market is Bullish, Bearish or Ranging as the case may be.
The Bullish Market Structure
In the Bullish Market Structure scenario, trade activities are represented with price action observed in an uptrend direction. This simply displays the formation of a Higher-High and Higher-Low trend which means that price actions are observed to trend above previous low points as well close above the previous high. Each time this scenario happens, it greatly shows that buyers in the trade are still capable of pushing up the price of that given asset.
(screenshot from Tradingview)
In simple terms, there is more Buying Pressure in trade than Selling Pressure or Demand exceeding Supply activities in trade. Therefore knowing this strategy would place the trader ahead of the trade by also making proactive open positions each time he observes those retest points.
The Bearish Market Structure
In the Bearish Market Structure scenario, trade activities are represented with price action observed in a downtrend direction. This simply displays the formation of Lower-Lows and Lower-High trends which means that price actions are observed to trend below previous low points as well close below the previous high. Each time this scenario happens, it greatly shows that sellers in the trade are still capable of pushing down the price of that given asset.
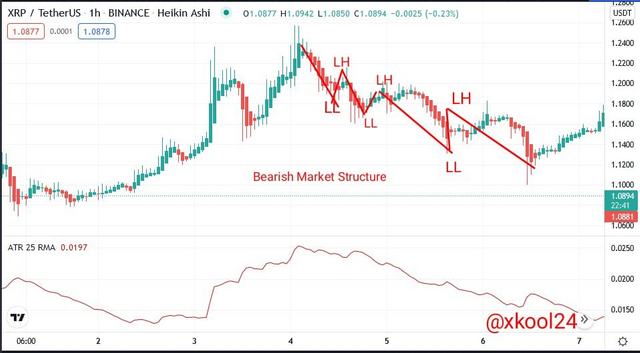
(screenshot from Tradingview)
In simple terms, there is more Selling Pressure in trade than Buying Pressure or Supply exceeding Demand activities in trade. Therefore knowing this strategy would place the trader ahead of the trade by also making proactive open positions each time he observes those retest points.
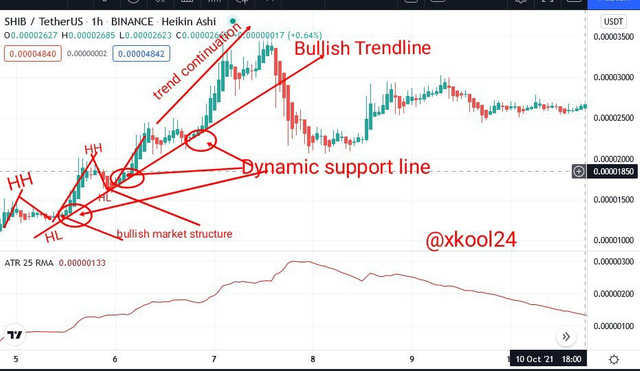
Bullish Trendlines
Trendlines are part of technical analysis used by traders to detect trade direction by drawing a line connecting points of the trend either as Resistance or Support points. It is bullish when the price trend is observed to be in an uptrend with price action above Trendline and Trendline serving as a support level. The Trendline, in this case, is the Dynamic support for market trend as trends are mostly observed to rebound each time it hits the trendline. This can also serve as an entry point to make trade position as there is anticipation that buying pressure can still push up trade.
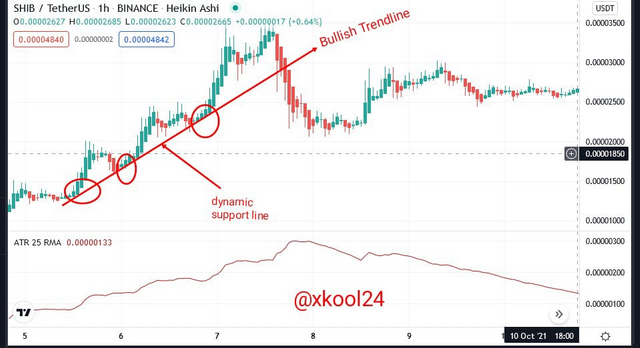
(screenshot from Tradingview)
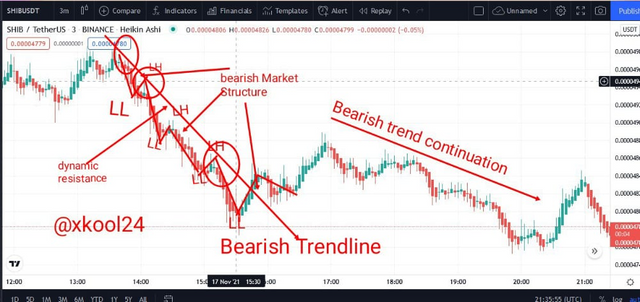
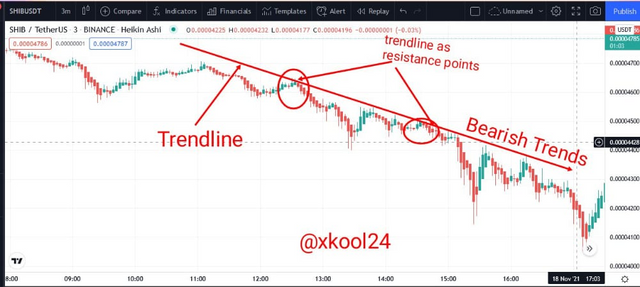
Bearish Trendlines
It is a bearish trendline when the price trend is observed to be in a downtrend with price action below Trendline and Trendline serving as a Resistance level. The Trendline, in this case, is the Dynamic Resistance for market trend as trends are mostly observed to rebound each time it hits the trendline. This can also serve as an entry point to make trade position as there is anticipation that the more observed Selling pressure can still push down trade.
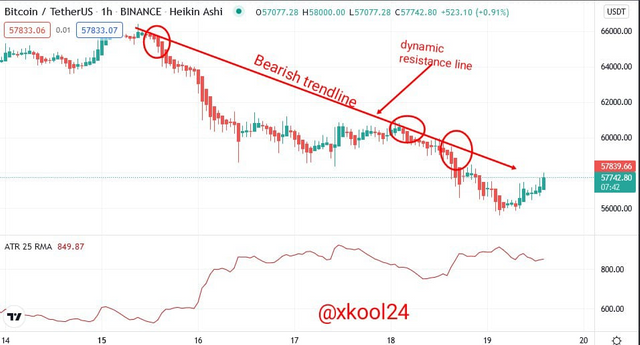
(screenshot from Tradingview)
Question 3
Explain trend continuation and how to spot them using market structure and trendlines. (Screenshot needed). Do this for both bullish and bearish trends.
Trend Continuation
There is no chart analysis that is observed to have only trend continuation rather market trends are of the mix of the different trade dynamics which include an uptrend, Downtrend, Sideways (Ranging), Retracements or Retests, etc. Due to the forces of buying and selling activities which are determined by the forces of Demand and Supply are observed to follow a zig-zag movement as well pullbacks. Therefore each time these pullbacks are observed, trends are also observed to continue in their initial direction, hence the formation of trend continuation.
In a Bullish trend where market prices go up, there is more presence of buying pressure than selling pressure which brings about breaking up resistance levels/points with possible retracements due to profit-taking and hence Trend continuation as demand is strong enough to keep the market on the path of pushing up price action, hence trend continuation.
Spotting Trend Continuation in a Market Structure
This scenario may be seen when price movement is on an uptrend with occurrences of Higher-Highs and Higher-Lows as well as in a downtrend scenario with Lower-Lows and Lower-Highs, hence the formation of trend continuation. .When these retracements are seen, they are pullbacks which are basically from profit-taking but the trend continues on the path of bullish or Bearish movement as the case may be.
Trend Continuation in a Bullish Market Structure
In a bullish market Structure, we do know that price movements are observed in an uptrend where we have the formation of Higher-Highs and Higher-Lows and thereafter still maintain its initial direction, hence Bullish Trend Continuation. This simply shows that the buyers are able to keep the trend in the path of more buying pressure than selling pressure. Therefore the ability of the market to still maintain its initial trend direction after retracements, Retests, Oullbakcs, Drawbacks is the TREND CONTINUATION.
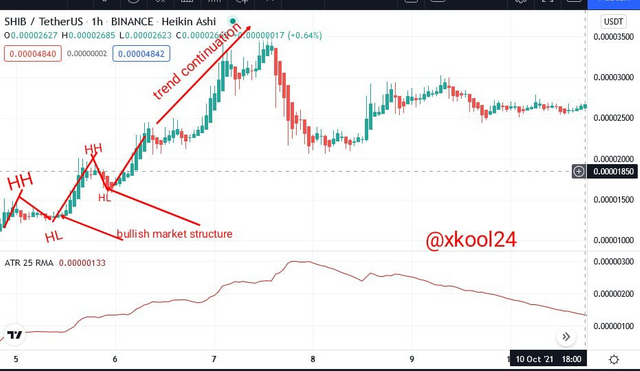
(screenshot from tradingview)
Trend Continuation in a Bearish Market Structure
In a bearish market Structure, we do know that price movement are observed on a downtrend where we have the formation of Lower-Lows and Lower-Highs and thereafter still maintain its initial direction, hence BearishTrend Continuation. This simply shows that the sellers are able to keep the trend in the path of more selling pressure than buying pressure. Therefore the ability of the market to still maintain its initial trend direction after retracements, Retests, Oullbakcs, Drawbacks is the TREND CONTINUATION.
(screenshot from tradingview)
###### Trend Continuation in a Bullish Trendline
In a Bullish Trendline, we observe that the bullish price trends are above the Trendline and act as dynamic support to price movements. As the trend hits this dynamic support line, it rebounds and continues in the path of bullish and hence trend continuation. The is more buying activities are observed to keep the market price in the path of Uptrend.
(screenshot from tradingview)
###### Trend Continuation in a Bearish Trendline
In a Bearish Trendline, we observe that the bearish price trends are below the Trendline and act as dynamic resistance to price movements. As the trend hits this dynamic support line, it rebounds and continues in the path of bearish and hence trend continuation. The is more selling activities are observed to keep the market price in the path of the Downtrend.
(screenshot from tradingview)
Question 4
Pick up any crypto-asset chart and answer the following questions -
i) Is the market trending?
ii) What is the current market trend? (Use the chart to back up your answers).
(screenshot from tradingview)
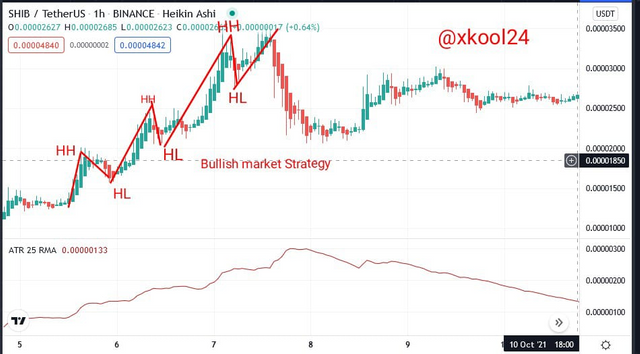
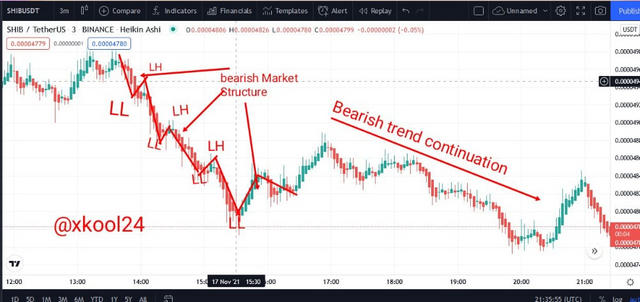
SHIB/TetherUS Pair with 3M Timeframe
- YES, this asset pair is currently trending. For an asset to be represented as trending in chart analysis, that means it is either making some uptrend movement or a downward movement given to the Buy and sell activities. We can categorically say from the Chart that the asset pair is trending
- The current market trend is the Bearish Trend/ Downtrend. if we also look closer, we also have Trend continuation with zig-zag trend movements representing retracements/Retest points. In a Bearish trend, it is characterized by Lower Lows and Lower Highs.
Conclusion
A trending market makes it easier to know the market direction at any given time with the help of chart analysis. With this traders can now know how best to make trade positions given to the direction of trend vis-a-vis the presence of retracements and retest points.
Moreso, Trendlines are those dynamic support and resistance line that joins different points of the market trends. The interception o these points can also be observed as veritable signals to make trade position.
Thank you Prof @reminiscene01 for your lessons.
https://steemit.com/hive-172186/@abdulla1/achievement2-basic-security-by-abdulla-18-11-2021
Verifiy post plzz😥😌.
Hello prof, I'm still waiting for your kind review.
Cc: @reminiscence01
Hello @xkool24, I’m glad you participated in the 1st week Season 5 of the Beginner’s class at the Steemit Crypto Academy. Your grades in this task are as follows:
Observations:
This is correct. Retracement can occur in a bullish trend from the factor of profit taking from buyers when price goes high.
Recommendation / Feedback:
Thank you for submitting your homework task.
https://steemit.com/hive-172186/@junaidashfaq/achievement-2-task-basic-security-on-steemit-by-junaidashfaq
Please verify my achievement @xkool24
POWERING DOWN AGAIN SO NO VOTE
cc @reminiscence01 @sapwood
Yes, the tagsearcher is also showing a red border.
Thank you. We will be more careful now before curating and grading a task.
I think he started power down after i graded his work.
He started power after his work was graded. That is 3days ago.