On-chain Metrics(Part-2)- Steemit Crypto Academy- S4W3- Homework Post for professor @sapwood
Hello, steemians,
I welcome you all to my blog this week as I participate in the advanced lessons presented by Prof @sapwood on Onchain Metrics(Part-2). I hope I improve over part-1's performance this time. Let's begin...


Question 1
What is the difference between Realized Cap & Market Cap, How do you calculate Realized Cap in UTXO accounting structures? Explain with examples?
The Market Cap and Realized Cap are expected to represent the same factor but the indices required to generate its actual values are the separating factor. Let us see the different indices that separate this duo;
The Market Cap is simply derived from the direct multiplication of the Circulating Supply by the prevailing price of the asset at that given time wheres the Realized Cap derives its value from the summation of the different purchasing price value of the asset when it last moved by its quantity supplied.
The Market Cap gives a Macro value of an asset based on the prevailing price and quantity in circulation whereas the Realized Cap measures the Micro value of an asset based on its Last UTXO vis-a-vis its quantity supply rather than the prevailing high or low price as at the time of calculation in the trade.
Therefore the prevailing price for the Market Cap is simply the current price of the asset in trade whereas the Prevailing price used in calculating the Realized Cap is the last UTXO when it was moved. In simple terms, the last value of and maybe $10 when it was purchase and the current price is $35. The Realized Cap would use the $10 for ts calculation whereas the Market Cap would use the $35 for its asset price calculation.
Just as said in the lessons, **Time & Space does not matter when taking Market Cap into cognizance, it assumes a uniform high or low price for all circulating supply so far it has ever moved where the Realized Cap takes time and space of occurrence as a key into its analysis.
To calculate the Market Cap = Circulating Supply x Prevailing Price of Asset
To calculate the Realized Cap = Supply Value x Last UTXO price (of all UTXOs)
Example:
We will be using BTC which has a total of 200 UTXO with a circulating supply of the same 200 BTC. 60 UTXOs was last moved in 2011 with a value of $900, 40 UTXOs was also last moved in 2014 when BTC was valued at $48,000 and 100 UTXOs was moved last in 2021 when BTC was valued at $63,000. (Given that the current price of Bitcoin is $45,000).
To calculate Market Cap = 200 x 45,000 USD/coin
Market Cap = $9,000,000
To Calculate Realized Cap = (60 x 900) + (40 x 48,000) + (100 x 63,000)
Realized Cap = $8,274,000
From this illustration, we can see that the Realized Cap is lower than the Market Cap which posts a positive value on STORE OF VALUE for this UTXO. This means most users should be able to make profits vis-a-vis if they move their UTXOs.
Question 2
Consider the on-chain metrics-- Realized Cap, Market Cap, MVRV Ratio, etc, from any reliable source(Santiment, Glassnode, etc), and create a fundamental analysis model for any UTXO based crypto, e.g. BTC, LTC [create a model for both short-term(up to 3 months) & long-term(more than a year) & compare] and determine the price trend/predict the market (or correlate the data with the price trend)w.r.t. the on-chain metrics? Examples/Analysis/Screenshot?
Realize Capitalization
This is the actual representation of asset value in trade vis-a-vis when its UTXO was the last spend or moved. This takes into account the micro value of all UTXOs summed up which simply means the Last spent UTXO by the Price when it was last moved).
Short Term - 3 Months
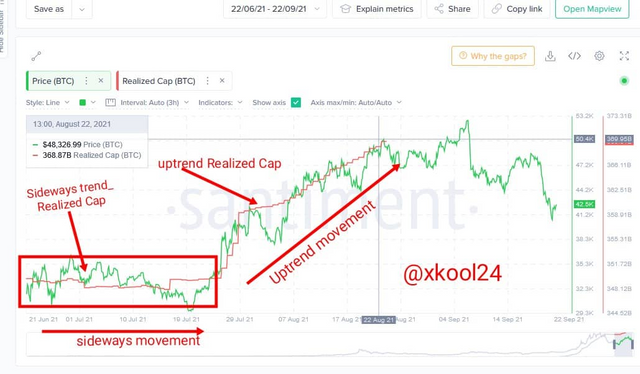
The screenshot above shows the BTC price action for 90days (3months). There was sideways movement seen in the price trend from the 21st June 2021 to 25th July 2021. Price value hovered between $34K to $35K respectively for those months and Realized Cap grew from $350B to $351B. But from the 25th July 2021, an uptrend was captured and this continued until it got to a peak on the 8th September 2021. Price movement changes were seen from $35k to $50k within this interval where Realize Cap grew from 351B to 369B.
long Term - 1 Year
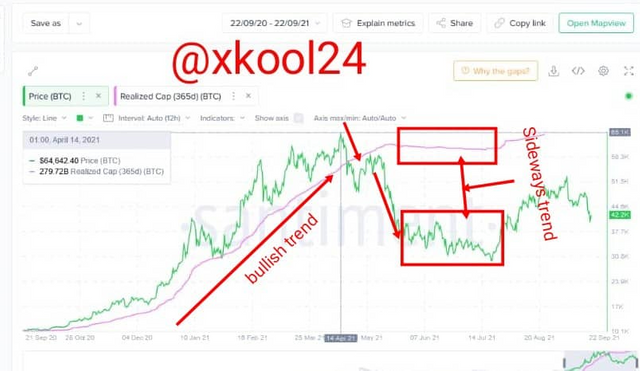
There was a little sideways price movement between 21st October 2021 and 28th October 2021 before a corresponding bullish trend. This was also measured up with an uptrend Realize Cap. On 8th January 2021, the price was $41k with a Realize Cap of 140B while on 21st Feb 2021, the BTC price was seen at $57k with a Realize Cap of 203B.
Also, we can see the Asset price at its peak where BTC was valued at $64k with a Realize Cap of 279B. Even with the Bearish trend later seen in price action, there was barely a downtrend change in the Realize Cap value. This simply means in some cases where price steeps, holders of these coins may not assert more selling pressure to sustain the trend instead they HODL which reduces the effect of drastic drop Realize Cap. An instance is where BTC was valued at $50k with a Realize Cap of 269B.
Price movement was also seen to the range and move in a sideways trend. We can see this from both price trend and Realize cap trend.
Market Capitalization
This is the estimated value of an asset in a trade which is simply derived from multiplying the prevailing asset price by the circulating supply. It does not factor time and space to derive its estimated value rather take into cognizance the values as at the time of report or when needed. Therefore, this gives a direct correlation between asset price and market Cap. When there is a drop in asset price, there is a corresponding drop in market Cap.
Short Term - 3Months
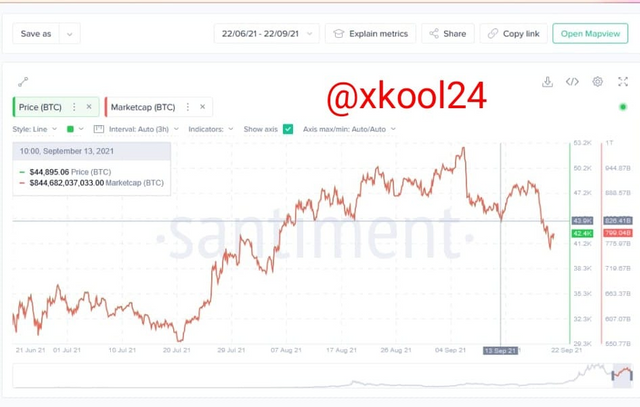
Just as discussed earlier where we mention that the Market Cap is directly affected by the asset price at any given time. When it is bearish, Market Cap tends to decline and when bullish, the market cap tends to increase. On 7th Sept 2021, BTC price peaked at $51k with a Market Cap of $964B but when it steeped a few days later with a price of $44k on the 13th Sept 2021, market Cap was captured to be $855B.
Long Term - 1 year
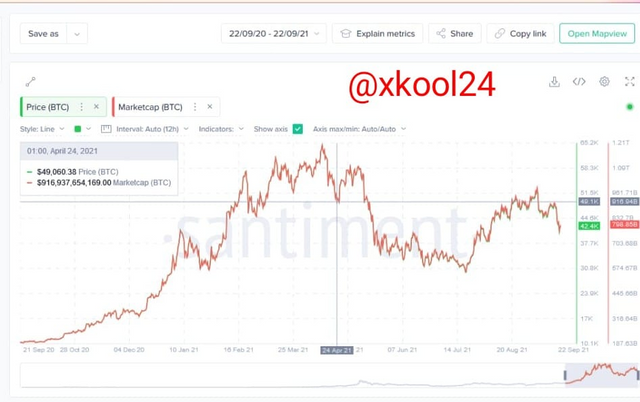
There is relatively the same scenario in its correlation. The asset price and market cap0 tend to move in the same direction/Trend. An effect in price change relatively changes the Market Cap either in an upward or Downward value as the case may be. On 14th April 2021, BTC price was $64k with a Market Cap of $1.2T but 10days later on the 24th April 2021, the asset price was $49k with a Market Cap of $916B. This invariably shows the direct relation between this duo.
MVRV Ratio
Just like the market Cap and Realized Cap, the MVRV ratio is an On-chain metric derived from diving the Market Cap by the Realized Cap. It gives us the average profit and loss in a trade as well as having a corresponding correlation with price action. It is also seen to determine trade momentum that tells us when an asset is either overvalued or undervalued as well as taking into cognizance readings between bands 1 to 200. When trends are seen below 100, it simply shows a negative market and bear trend. But when it is above 100 bands, it shows a positive market as well as indicate a bull trend.
Short Term - 3 Months
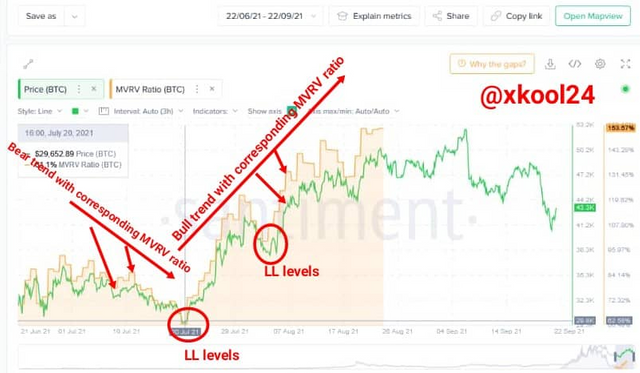
As we know, the MVRV ratio directly correlates with price movement and from the screenshot, we can deduce that each time market price attends a High high, we have the MVRV ratio making corresponding High high levels too. The same scenario is seen when we have High Lows, Low Highs and Low lows levels.
For Instance on 20th July 2021, we have a Low Low level where the price was at $29.6k and the MVRV ratio was at 62.68%. We also have Lower low levels where the price was $38k with an MVRV ratio at 98% which clearly shows a negative market and bear trend. We can only anticipate a bull trend as market corrections in this scenario.
Long Term - 1 Year
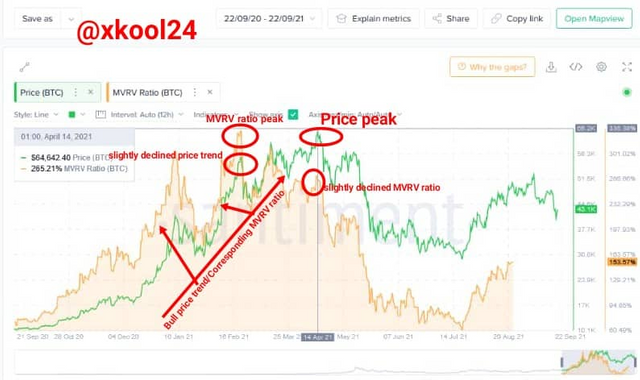
The long term scenario is not different from the short term scenario where we have evident bull trends with relatively price peaks with corresponding MVRV ratio correlating with Market Trend.
Though there are scenarios from the chart where the peaks of various elements were seen correlating with the other but with a decline in Price trend or MVRV ratio. For instance, on the 13th April 2021, the price was seen at $64.9k but the MVRV ratio was seen with a correlating decline value of 269% and when the MVRV peaked on 21st Feb 2021, the MVRV ratio was 335% but the Price was seen as a little lower with a value of $57k.
Observations
There is no doubt that Short Term scenarios for an asset come with a lot of false signals which may not truly give the trend position of asset vis-a-vis the Long term Scenarios with filtered results. These three elements which include the Market Cap, Realized Cap and MVRV ration all have an integral part to play in the coins life cycle. I was able to deduce Price movement having a corresponding correlation with Market Cap, Realized Cap and MVRV ratio. But there were some variants in the MVRV ratio vis-a-vis price movement. Though both elements responded in the same direction, there was a decline of the other when another peak.
Question 3
Is the MVRV ratio useful in predict a trend and take a position? How reliable are the upper threshold and lower threshold of the MVRV ratio and what does it signify? Under what condition the Realized cap will produce a steep downtrend? Explain with Examples/Screenshot?
MVRV Ratio in Taking a Position
The MVRV ratio is relatively a good indicator to take trade positions despite the fact no indicator is 100% perfect to predict price trends due to its dynamism. It is best used in Long term analysis and preferably in combination with other indicators.
It has a scaled percentage that bands from 0 to 200. This is relatively a good guide in the trade as when the market is below 100 it shows a negative trade state, bear trend and probably an undervalued asset. We should anticipate market corrections which in this case is Bullish. When the trend is seen above 100% bands, it shows a bull trend, a positive trade state and probably an overvalued asset. There is a likelihood of market corrections and hence anticipate a bearish movement.
The presence of Higher highs (HH), Higher lows (HL), Lower highs (LH) and Lower Lows (LL) are important trend indicators to guide on when we have strong and weak trends for possible trade positions.
MVRV Ratio Reliability - Upper Threshold
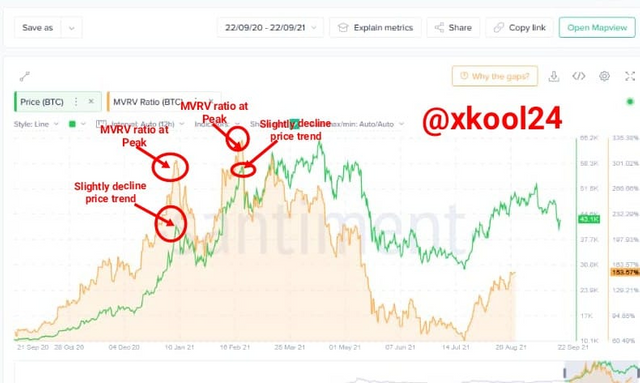
From the lessons, we already know that the Upper threshold of the MVRV ratio is largely not reliable. Despite the Bullish the tends seen at this level, there is a relatively slight price decline. Therefore the higher the upper threshold seen in the MVRV ratio, a relatively little price decline is captured. The coin at this end may be overvalued and hence there is a probability of significant selloff for profit-taking.
MVRV Ratio Reliability - Lower Threshold
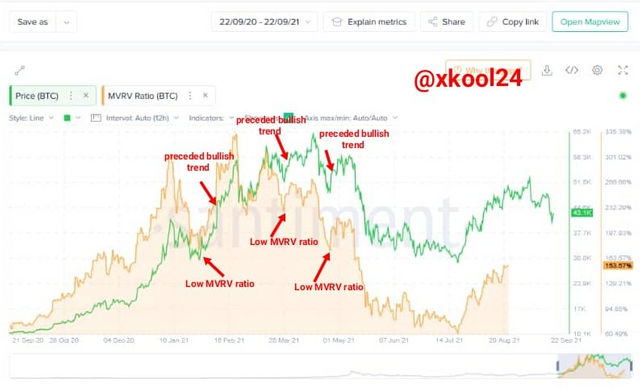
The lower threshold is proven reliable than what we have in the Upper threshold. This is simply because the presence of the MVRV ratio at a lower threshold is relatively preceded by a commensurate bullish increase in price movement. At this level, we usually anticipate bullish trends as there are significant entry positions.
Conditions that Produce Steep Downtrend in Realized Cap
We know that the Realized Cap is calculated by the value of all UTXOs of a given coin w.r.t price in which it was last moved/spent. Therefore for a steep Downtrend to occur in a Realized Cap, holders of the given coin must have significantly spent/move all their UTXOs lower than the last price they were seen moved/spent. It entails they must be spending to all incur losses since they are transacting when prices are far lower than their last entry positions for those UTXOs.
This is practically not feasible as we should be seeing coin holders significantly HODL at this period when prices are lower than their last UTXO price than spending them at that time. Users found to concur to this scenario of spending their UTXOs lower than their last entry price are usually infinitesimal. The majority would rather wait until prices are up for profit-taking.
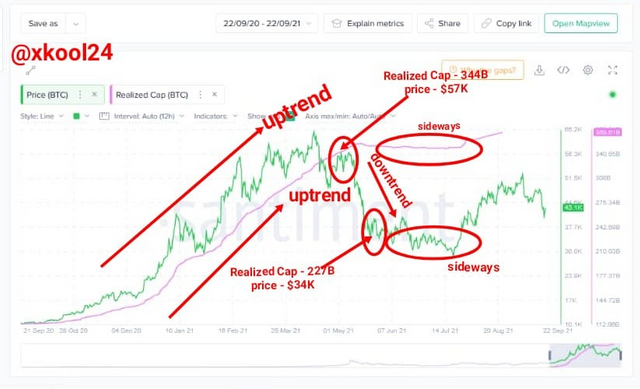
A typical scenario from the screenshot shows the last UTXO at the price/Realized Cap peak where Price was $57k and Realized Cap of $344B. We can also see another Lower Low level where the price was $34 and Realized Cap $227B, if most of the holders who made entry positions above this level exit trade, there would be a bit steep downtrend but we can this scenario hardly happens as the market corrected itself after a sideways (Undecided) movement and then Uptrend.
Conclusion
The Market Cap, Realized Cap and MVRV ratio are all key components of analysis that helps to determine the actual and estimated value of an asset in trade in correlation with price movement. The Market Cap variant (Realized Cap) helps in determining the actual value of an asset about the last UTXO of that given asset. This takes into cognizance the time and space of its occurrence. Whereas the Market Cap is a function of the circulating supply of an asset by its prevailing price.
The MVRV ratio which simply determines the average profit and loss of an asset can be used as a momentum indicator. This ratio is calculated by dividing the Market Cap by the Realized Cap.
Thank you respected prof @sapwood for this shared knowledge.
https://steemit.com/hive-172186/@steembabu/achievement-1introduction-to-myself-steembabu
Verify achievement sir @xkool24