Crypto Academy Week 10- Homework Post for Professor @stream4u - Topic: Price Forecasting.
In every investment, the two major things an investor wishes to know are the current price of the asset they own or plan to own, and what its price will be at a specific time in the future. Since this two major prices will determine if an investment is profitable or not, it not surprising that smart investors constantly review the history of the assets price as this help them to know what the future worth of the asset could be.
These reviews have most times proven helpful, further confirming King Solomon's claim that "there is nothing new under the sun". For this reason, most investors won't buy a stock or an index they believe should have corrected based on their review of the assets price history.
Since the major aim of every investment is to make profit, there is need for everyone who wishes to explore the trading market to learn all that is to know about Price forecasting so as to be able to predict what the market will be in the foreseeable future.
Am very grateful to be a part of Steemit Crypto Academy, am also thankful for being a part of Professor @stream4u lesson today. Thanks to the lesson I am now exposed to the concept of Price forecasting and can make some simple prediction on my own. Below is my response to the exercise given by the professor.
Question 1: WHAT IS PRICE FORECASTING?
Price forecasting is defined as the process of predicting the future price of an asset and the direction its current price will go by evaluating various factors such as demand, supply e.t.c, that control its pricing. The asset can be anything such as cryptocurrency, gold, coffee, e.t.c.
In the field of cryptocurrency, price forecasting is something no trader can do without. This is because of cryptocurrency's high "volatile" nature. Unlike some assets which you won't pay much for making a mistake in a trade, most times if a trader makes a wrong decision during cryptocurrency trading, he pays dearly for it. This makes price forecasting an indispensable tool for every cryptocurrency trader.
Question 2: WHY IS PRICE FORECASTING NEED?
No market is steady. Even a look at the chart shows how true this statement is, as no candle stick remains in a position for up to 30 seconds. When a trader looks at this movement, he is bothered by three major questions:
- when do I enter a trade?
- In what direction will I predict that the price of an asset will go?
- When do I leave a trade?
Knowing the right time to entire a trade is as much importance as the trade itself. Entering when is almost at the end of it will yield very little profit. Also entering a trade too soon may not always be the wisest decisions as some of the trades change direction soon after trade and continue in the opposite direction. This becomes a loss to a trader.
Concerning the direction to trade, each time the right predictions are made in any trade, including cryptocurrency trading, the trader makes profit regardless of whether he predicted the value of the asset will rise or will fall in a specified future. But if unfortunately the prediction made by the trader doesn't go in the direction he predicted he loses at the same rate as he would have gained.
When to leave a trade is another area of concern. Leaving a trade too soon just because it begins to go down the way opposite what you predicted may not be the best of decision as sometimes trades like that reverses back to the predicted direction and remain there for a long time, thus leading to more profit for the trader.
These decisions are risky decisions, and since no one has seen the future, price forecasting is the best bet for everyday if he/she will ever make good trading decision. As it help the trader know when you're invest big capital or small amount, and manage every other risk involved in the trade.

Question 3:WHAT METHODS DO YOU FEEL ARE BEST FOR PRICE PREDICTION / FORECASTING?.
There are several methods of making price forecasting. Each of these methods use tools and events to make prediction. Some of these tools are economic news, government policy, chart patterns, and lots more. Based on which tool they use, they are classified into the following methods:
- Technical Analysis
- Fundamental Analysis
- Sentimental Analysis
Technical Analysis
This price forecasting method makes use of statistical and historical data to forecast what the price of an asset will be in the nearest future. This means that the technical analysis makes use of informations obtained through indicators, supports, resistance, candlesticks chart patterns, volumes e.t.c in making important trading decisions.
Every past action of a particular asset is an important factor in the decision making process of Technical Analysis.
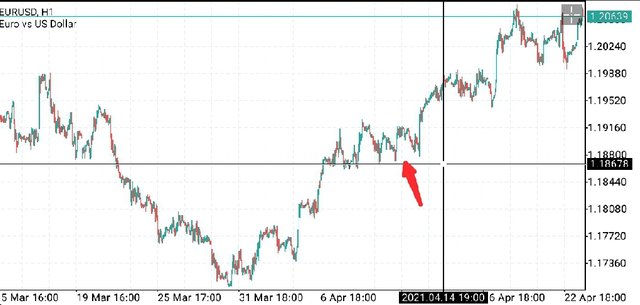
To better understand this, let's consider an example. If for instance a trader noticed in the trade chart that the price of an asset has comes down twice to support level in the recent market, he could easily predict that it is best to buy in the next rise from the support level.
Below is a trade chart from Meta5 showing the trades EURUSD trade recorded in April 2021. The price peaked after the second return to the support level and has been on the high since. Any trader who had clicked on buy would have made lots of profit.
Another example is when a bullish candle is formed at the support level, a smart trader can easily forecast that its more profitable to buy the asset as it is on the upside.
The simplicity in using Technical Analysis in making predictions has made it one of the most used method of price forecasting.
Fundamental Analysis
The fundamental analysis method of price forecasting doesn't involve charts and candle sticks like we see in the Technical Analysis. In fundamental analysis, prices of an asset are predicted based on economic factors such as demand and supply of an asset, a certain company signing a new deal, new government policy's e.t.c.
In simpler terms, fundamental analysis suggests that prices of an asset is highly influenced by decisions and events. An example of this can be seen in the case of Miguel Torres the Bantamweight contender, and UFC. Then, Torres was a notable figure among UFC fans having a fantastic win record of 40-4. On December 2011, Torres posted a tweet that says:
If a rape van was called a surprise van more women wouldn't mind going for rides in them.
Few minutes later he deleted it.
You might see this as just a tweet, but it isn't. As small as this tweet was, this tweet caused so much unrest that UFC had to release Torres from his contract with them in other to save themselves.
You know people actually invest in these fights. Had it been that UFC had not made that quick decision to release Torres they would have lost a lot. In fact, even the few minutes the post was on Twitter, if affected the UFC market measurably.

Assuming that UFC is tradeable, a trader who makes his price forecast using fundamental analysis will know that the event has created the best opportunity to sell. A trader who only uses only Technical Analysis in his prediction might predict wrongly that the price of UFC will be on the rise based on his knowledge of Torres's past performances and therefore "buy" UFC only to experience so much loss in his trade.
Sentimental Analysis
Just as the name implies, Sentimental analysis are done based on sentiment rather than logic. For instance let assume you are in a trading WhatsApp group, filled with professionals and you are fairly or not experienced yourself, one day, you notice that everyone is buying on a particular asset. Although, based on your little understanding of the trade you think it's the best time to sell, sentimental analysis suggest that you should buy as everyone is buying. The reason is that if a large number of people (support group) buys a particular asset, if large enough, it can create a volatility that will cause the price of the asset to skyrocket.
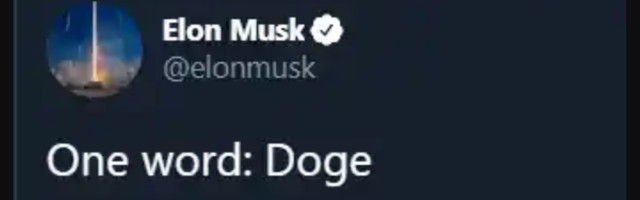
A perfect example of this is what Elon Musk and his supporters have been doing with DogeCoin since the December 20th of last year. The first time Elon musk tweeted
One word: Doge
The value of Doge coin pumped 15% in less than 10 mins! Wow.
What really happened? Most of the people who traded DogeCoin and keep trading it each time Elon musk tweets "DogeCoin" exploits the loophole of Sentimental analysis in making profit. Regardless of the performance of DogeCoin in past trades, every time Elon Musk will tweet about DogeCoin, him and his large support group will cause the price of the coin to go bullish. For this reason every trader must obey the Golden rule of trading which says:
Never go against the Market.
Question 4: TAKE ANY CRYPTO ASSET CHART GRAPH AND EXPLAIN HOW TO DO PRICE FORECASTING; TELL WHAT WILL BE ITS FUTURE PRICE FOR THE NEXT ONE WEEK
To show how to make predictions for any crypto asset using price forecasting, I will be performing a Technical Analysis on ADA/USD, using a chart obtain from my eToro version 317.0.0. In this analysis, I will be making use of tools such as support, chart patterns, candlesticks and lots more to predict the future price of ADA in the next one week.
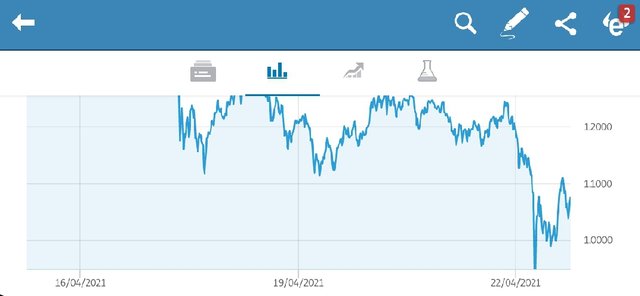
The trade chart above, shows the the weekly chart for ADA/USD. According to the chart, earlier this week, we saw ADA/USD fall from $1.24 to $1.12. It rose again and after few hours declined and came back to $1.23, creating a support line.
Based on market behavior, if the trade happens to come back to the support line for the third time, there is high chances that there will be a change in the market behavior. This means that if the trade were to get to the support line the third time, it's best to buy.
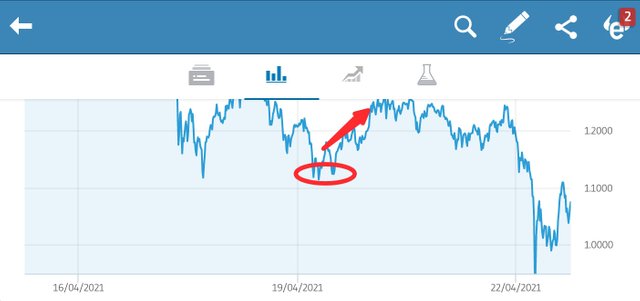
As we can see from the graph above, after the trade touched the support line the third time, the market changed and the price began to rise. Any investor who bought at that time would have made good profit.
As the price got almost close to $1.3 the trade became fairly stable going down once but not close to the support line (meaning the trade is still safe).
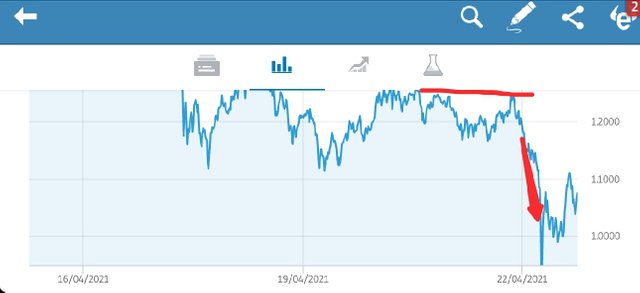
Within two days, we noticed the formation of double top as shown above. Whenever double top occur the market is expected to reverse. As predicted the market reversed making selling profitable.
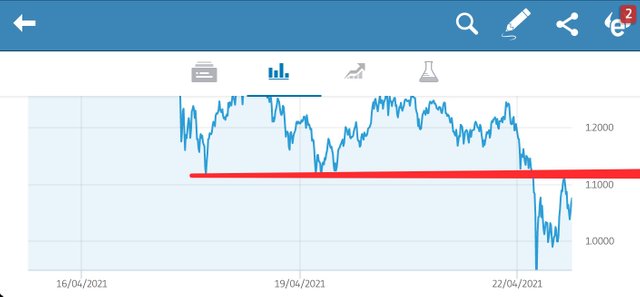
Unlike the first time the price went down, this time around it went down past the support line (as shown below) to an all time low of $0.20 (forming a breakout). From there it rose again to $1.18 and down again, forming a new support line at approximately $1 from which is rose $1.12 and down again to $1.08 but not close to the new support line.
MY PREDICTION:
Considering the chart, For a week trade, an initial "sell" of ADA/USD at the beginning of the week would have been a good investment as on the long run the market price of ADA/USD as of today is not up to what it was in the beginning of the week.
For next week, there are two major pointers to watch out for: the newly formed support line and the "breakout or breakaway".
The newly formed support line suggest a reversal in the market. This means that the price of ADA is on the rise. Since the price is on the rise the best decision is to buy.
Considering the breakout, most times after a "breakout" in the downwards direction, it is always hard for a coin to go back to the high price it was before the fall.
Putting both conditions together, it is safe to say, based on given data, that the best prediction for ADA for next week is to buy, nonetheless the value of ADA/USD will not exceed $1.25.
(That is if factors like government policies and sentiments does not influence the market).
In Conclusion
The trading market generally is a high risk market, and without the aid of price forecasting, the trader is doom. For this reason, everyone who wishes to engage in cryptocurrency trading must first learn how to carry out price forecasting. Anyone who fails to do so, will surely tell countless stories of painful losses.
Thank you Professor @stream4u for the amazing lesson.
References
Predicting a market performance
Hi @whileponderin
Thank you for joining The Steemit Crypto Academy Courses and participated in the Week 10 Homework Task.
Your Week 10 Homework Task verification has been done by @Stream4u, hope you have enjoyed and learned something new.
Thank You.
@stream4u
Crypto Professors : Steemit Crypto Academy
Thank you so much Professor @stream4u.