Crypto Academy Week 5 Homework Post for @stream4u | All About SuperTrend Indicator
Hello to the Future Traders,
Another great lesson provided by @stream4u. I'm learning a lot from this great content and very happy about my own progress 😇 I invite everyone who loves to be a trader to become a part of the Academy.
This week its all about the SuperTrend indicator. If you are keen to get into the trading then you must understand the concepts and ultimately applying such strategy in crypto trading. However, we must also note that none of the strategy or different approaches will not work 100% in accuracy neither guarantee success every time. Risk is upon yourself and learning and practicing the right skills to use indicators will be essential. These indicators will only maximize the chances of better decisions.

-----------------------------------------------Introduction to the homework task---------------------------------------------
Let’s see this week homework 👇
Homework Task (Topic 1):
What Is A SuperTrend Indicator?
SuperTrend indicates the current trend direction on the trading chart. There is a single line which is constantly
switching between green and red. When the SuperTrend line colour turns Green from Red on the chart it signals that the market is on uptrend and indication to place a BUY order. Vise versa, when the SuperTrend line colour turns Red from Green on the chart it signals that the market is on downtrend and indication to place a SELL order.
It uses a calculation method called ATR (Average True Range). What the calculation does is, it measure the volatility of the of the market. However, since the indicator is used for both short term and long term trades, volatility of the market on different chart can have a different indications.
Homework Task (Topic 2):
How to set SuperTrend on Chart and what are its settings need to configure?
Indicators such as SuperTrend are tools with technical analysis which tells a trader about the future possible market behaviors. This allows us to predict how the market is going on and based on that we can asses direction and trends.
Like SuperTrend Indicator there are many popular technical indicators available for traders, Below are a few example to check.
- Moving Average Convergence Divergence (MACD)
- Relative Strength Index (RSI)
- On Balance Volume (OBV)
- Bollinger Bands
- Moving Averages (MA)
- Fibonacci Retracement
Likewise, there are many technical indicators on offer. The best option is to try as many as possible and check what works better for you. Because what works best for someone will not be the best indicator for you.
So, where can you find all these indicators!
You can use the trading view platform.

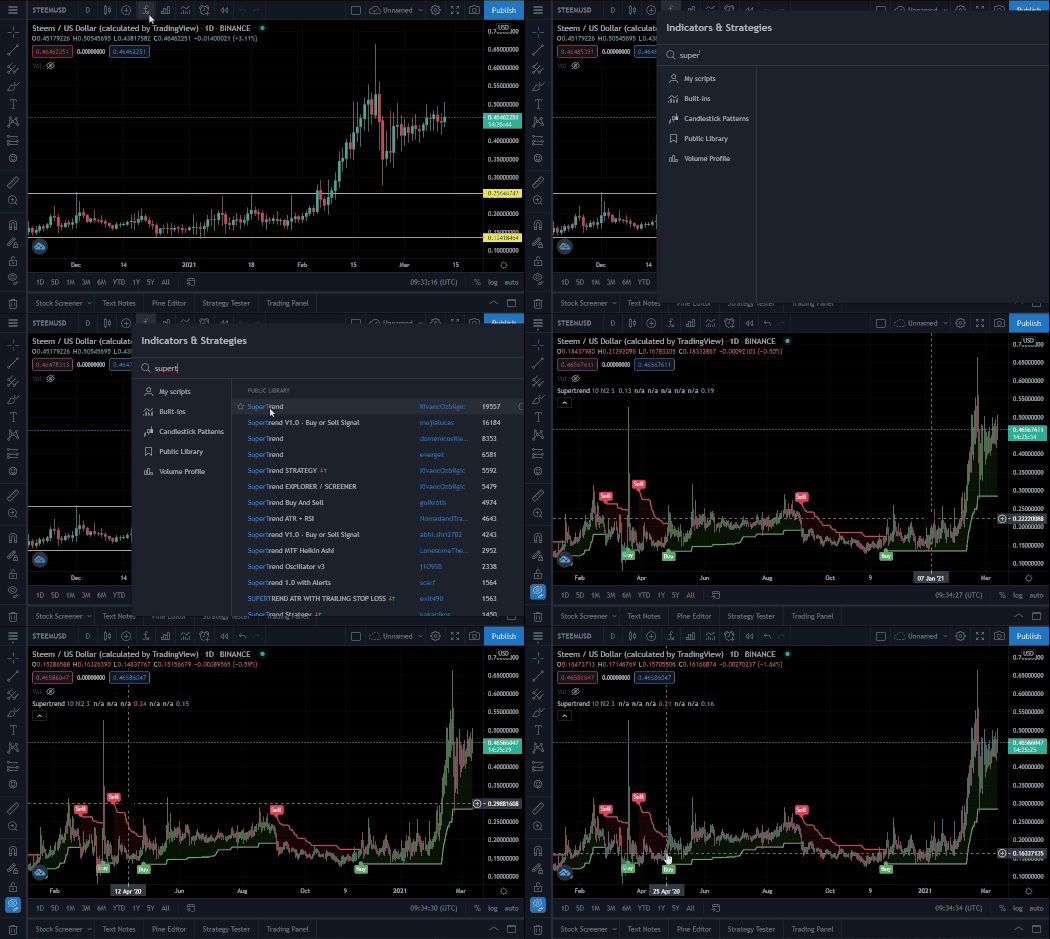
------------------------------------Indicators and Strategies available in Tradingview----------------------------------
Once you find the indicator simply type "SuperTrend" and then select the indicator from the list.

------------------------------------Way to activate the SuperTrend Indicator ----------------------------------
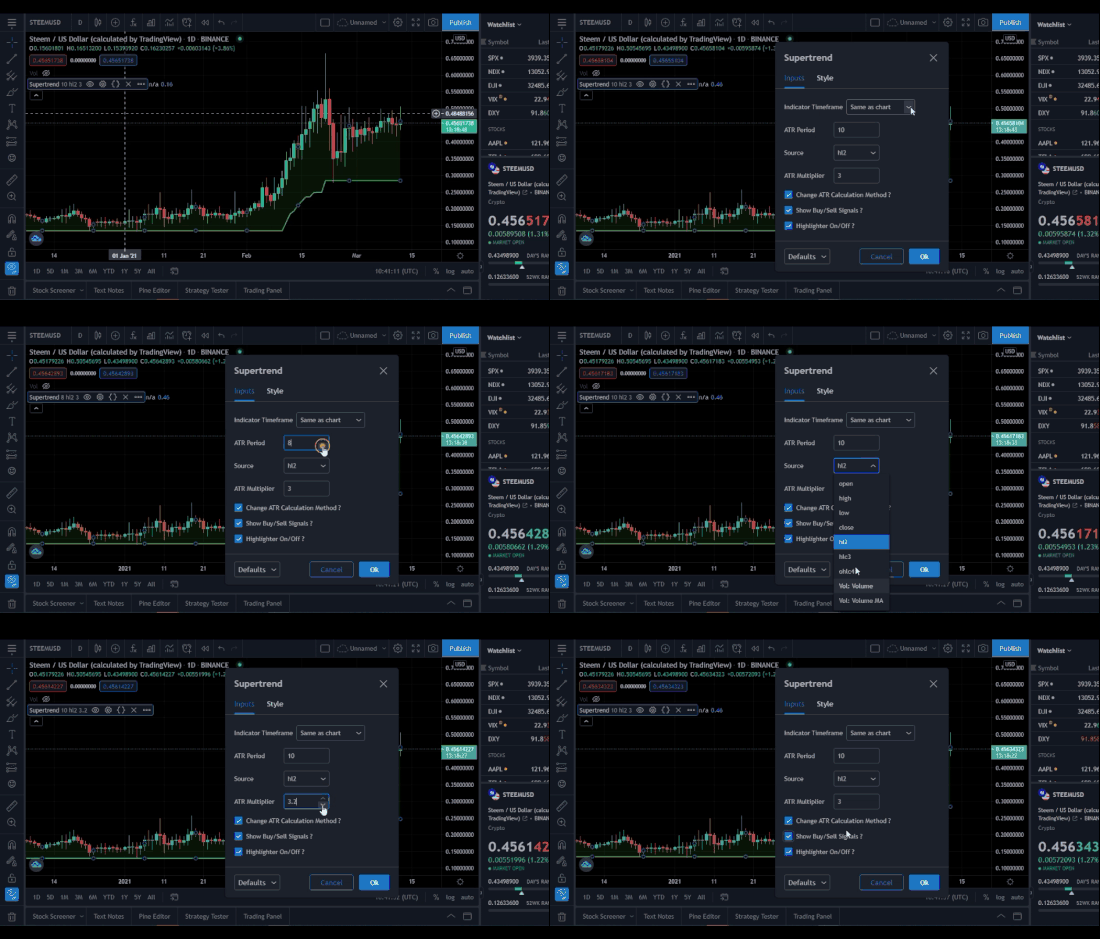
- Settings to configure
In the setting you have 02 options,
The first one is the Inputs
Here you can see a few different options to choose.
Indicator Time Frame: Here you can select the time frame you want. In default it will be set same as to the chart time frame.
ATR period: This tells the SuperTrend Indicator how many candles to look back when calculating the value.
ATR Multiplier: This determines the distance between the SuperTrend line and the candles.

------------------------------------ SuperTrend Settings - Inputs ----------------------------------
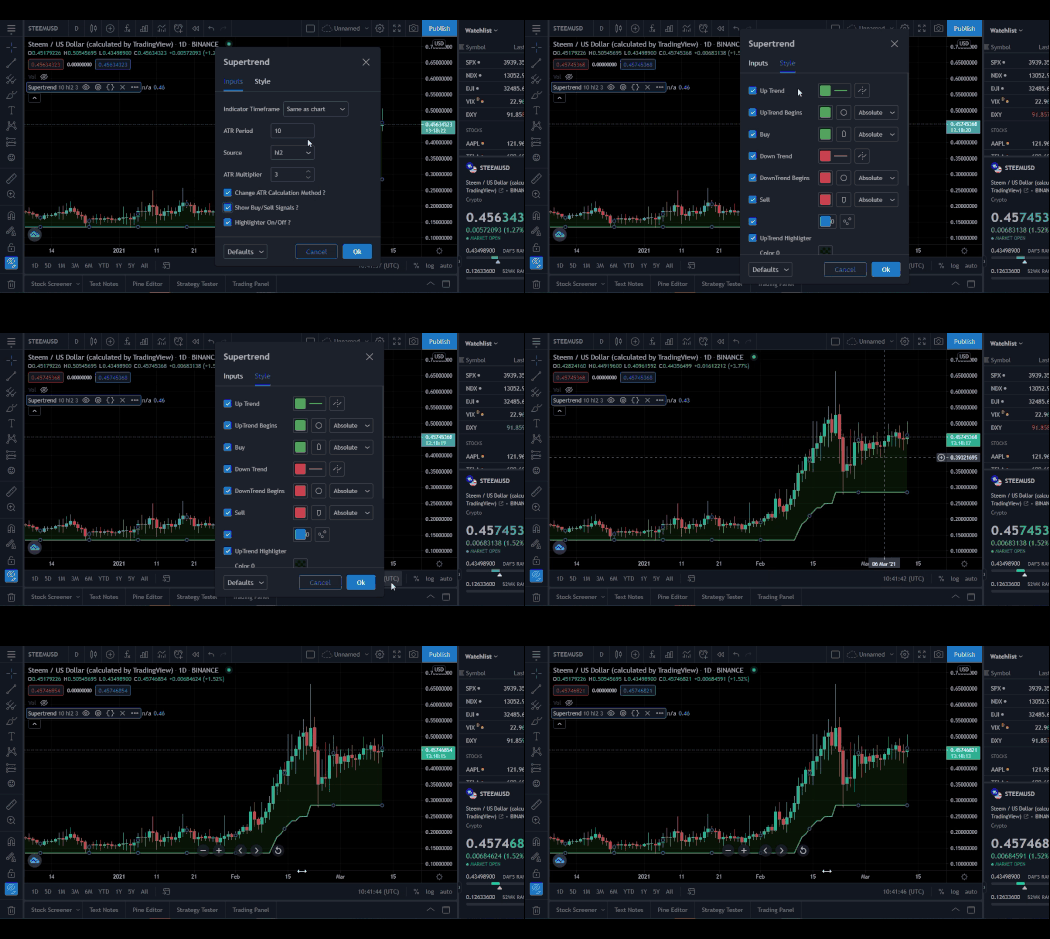
Second one is Style
In the style you basicaly can change how SuperTrend line look like. You can change the colour of the uptrend & downtrend lines according to your preference.

------------------------------------ SuperTrend Settings - Style----------------------------------
Homework Task (Topic 3):
How SuperTrend Shows Buy-Sell Indications?
- Buy Indications
The buy signal usually generated when the SuperTrend line is beneath the current price. That's where the SuperTrend line switches from Red to Green colour. The correspondent candle will signal a buy trade and we can set the stop loss just below the line. Once the price set up to a uptrend we can set the stop loss along that trail. If the uptrend continues there can be several indications.

------------------------------------ Indicator suggestions for BUY signal----------------------------------
- Sell Indications
When we have a candle which will come down and touch the SuperTrend line that will be the indicator to take us from the trade. This happens when the SuperTrend line switches from Green to Red colour. The current price level goes up from the SuperTrend line too. This usually signals a downtrend to the market.
------------------------------------ Indicator suggestions for SELL signal----------------------------------
Homework Task (Topic 4 & 5):
When We can place a Buy or Sell Trade with the help of SuperTrend Indicator?
According to the previous image in Buy Indications we had 03 BUY signals and 02 SELL signals generated by the SuperTrend line. If we entered trading using the exact signals for Buy & if we square off the trade at the Sell signal we would have end up with either losses or break even trades as one winning and one losing.

------------------------------ 01st BUY signal winning trade with a small margin------------------------------
------------------------------ 02nd BUY signal Losing trade with a small margin------------------------------
Hence, identifying and establishing when and where to set Buy or Sell trade is the most important part of a trade. By recognizing support and resistance on a chart will help a trader to identify the direction of the market and to correct time to enter to the market.
Resistance occurs when the price level at which selling power is strong enough to prevent the price from rising further. Wherein support occurs when the price level at which buying power is strong enough to prevent the price from declining further. This supply and demand changes constantly and what we have to understand is when the price gets closer to the support level price will become cheaper and cheaper. That is where the most buyers will see better deals.
However in the process when the sellers get cheaper deals they will less like to sell. This will make the supply less and there onwards market expect to revers the bearish run. But this concept or theory will not work forever. If there's a breakout trader should have a stoploss level to limit the losses.
Homework Task (Topic 6):
How false indications look in SuperTrend Indicator?
SuperTrend will always give us the best result when there is a trending market. However when we have sideways moving market we cannot except the same success rate. Also we must note that losing trades are inevitable part of any trading strategy and the SuperTrend Indicator is no exception for this.

------------------------------ False indications when there's sideways moving ------------------------------
Homework Task (Topic 7):
According to your view what Stoploss you will suggest?
To overcome such loses the best strategy would be to use Stoploss level. Because it will ensure that your loses will be limited. It will act as a security position and a risk management for your trade.
Hence, we have to identify the lower lows of the current price on the chart and their you can set the stoploss. Also Identifying the upper range boundary will indicate the market volatility for the period. Once these are correctly identified we can ignore the sell signals indicates by the SuperTrend Indicator and wait for the uptrend to break outside of the range we created.

------------------------------ Stoploss strategy to overcome sideways moving ------------------------------
Conclusion
Well as to my opinion this indicator is super easy to use. Specially for the beginners this is a must for a trading tool. If traders can correctly understand the Buy and Sell signals and overcome false indications by the experience this indicator will be as efficient as any other tool. Though there are some negative indications, overall this indicator provide much information for trader to make sound decisions.
Thank you Steemit Team & @stream4u
#supercrypto #stream4u-week5 #cryptoacademy #srilanka #supertrend


Hi @virajherath
Thank you for joining Steemit Crypto Academy and participated in the Homework Task 5.
Your Homework task 5 verification has been done by @Stream4u.
Thank You.
@stream4u
Crypto Professors : Steemit Crypto Academy
Thank you for the verification @Stream4u
You have been upvoted by randulakoralage A Country Representative. we are voting with the Steemit Community Curator @steemcurator07 account to support the newcomers coming into steemit.
Follow @steemitblog for the latest update.