Steemit Crypto Academy Season 3– Week I—Trading Crypto With Ichimoku-kinko-hyo Indicator Part 1 by @kouba01
INTRODUCTION
Hello fellow steemians it's the beginning of season 3 of the steemit Crypto Academy. Am sure we all learnt alot from the season 1&2 respectively. Here is another season and I wish everyone a success experience in the season 3.
Today's lesson is about the Ichimoku-kinko-hyo trading indicator
What is the Ichimoku Kinko Hyo indicator? What are the different lines that make it up?
The Ichimoku-kinko-hyo Indicator is a Technical analysing tools invented ba a Japanese journalist named Hosoda Goichi he created this indicator with a couple of students based on their talent in mathematics and equations to try out many time - dependent equations.
This is a type of indicator that predict future price and also determine the areas of support and resistance. This indicator performs three functions in predicting price value.
First of all it determines the future price of the market. This is one major work of some indicator and it also determine the areas support and resistance in the market trend. Performing all this function makes it a kind of unique indicator. Not all indicator can perform three analysis at a time. But the Ichimoku-kinko-hyo Indicator is capable of doing so.
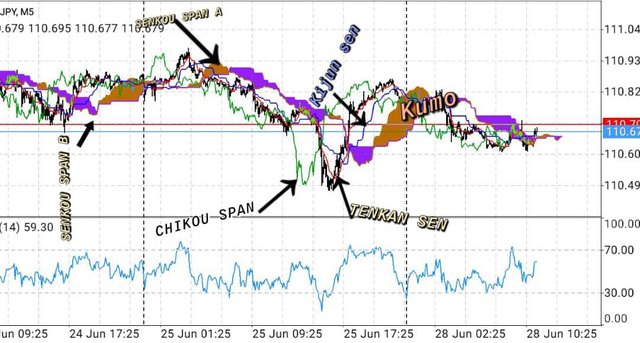
The Ichimoku-kinko-hyo Indicator consist of 5 lines analysing the Crypto chart for both price and market trend. Four of this line are paired. They works together. So we can then classified them into three groups
- The Tenkan-Sen and the Kijun-Sen
- The Senkou Span A and Senkou Span B
- The Chikou Span
This are the lines that make up the Ichimoku-kinko-hyo Indicator and they have their different calculations. This lines are what we use to analyze our Crypto chart before trading and while trading.
How to add the Ichimoku indicator to the chart? What are its default settings? And should it be changed or not?
To add the Ichimoku-kinko-hyo Indicator on the metatrader4 app it's just a simple step that is required. I will explain how to add it with screenshot from metatrader4.
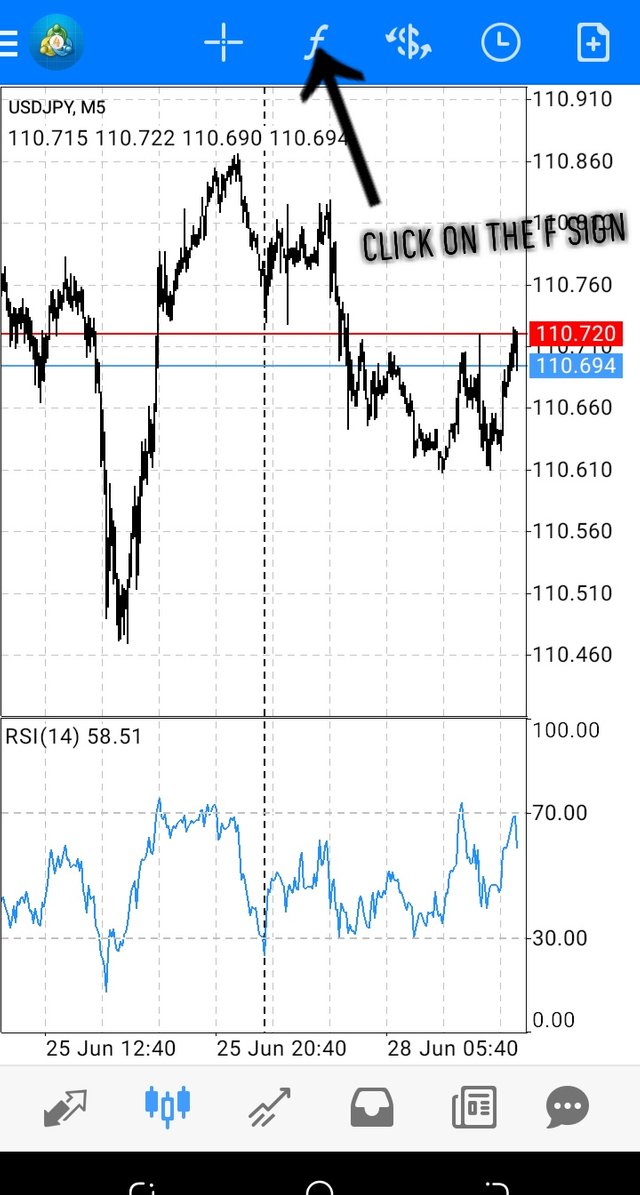
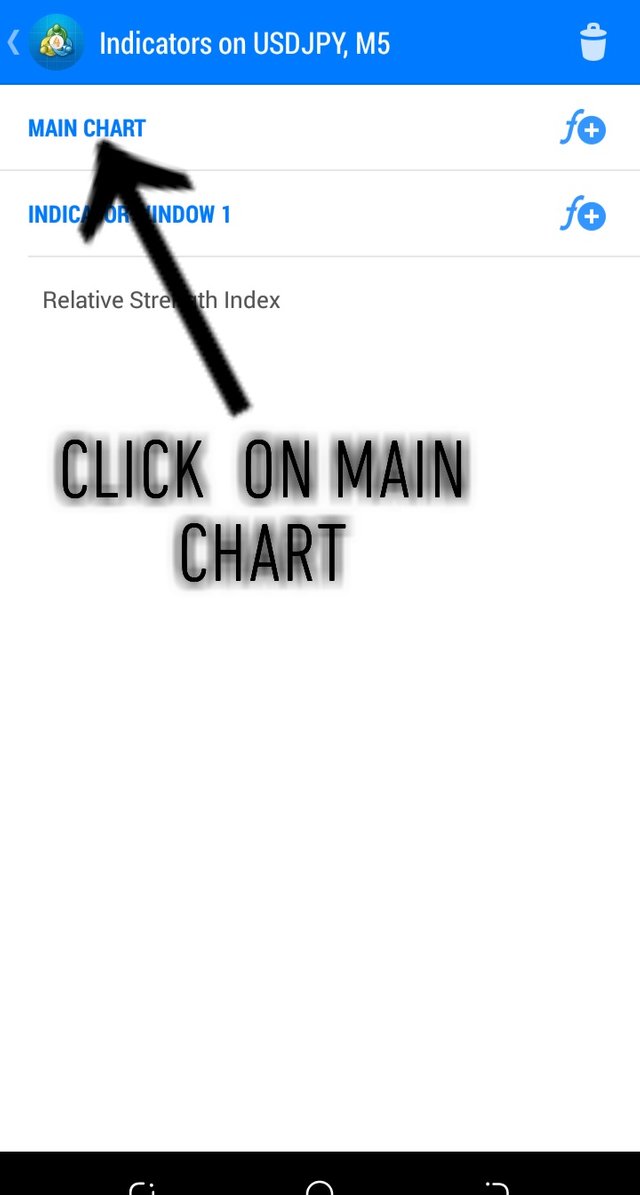
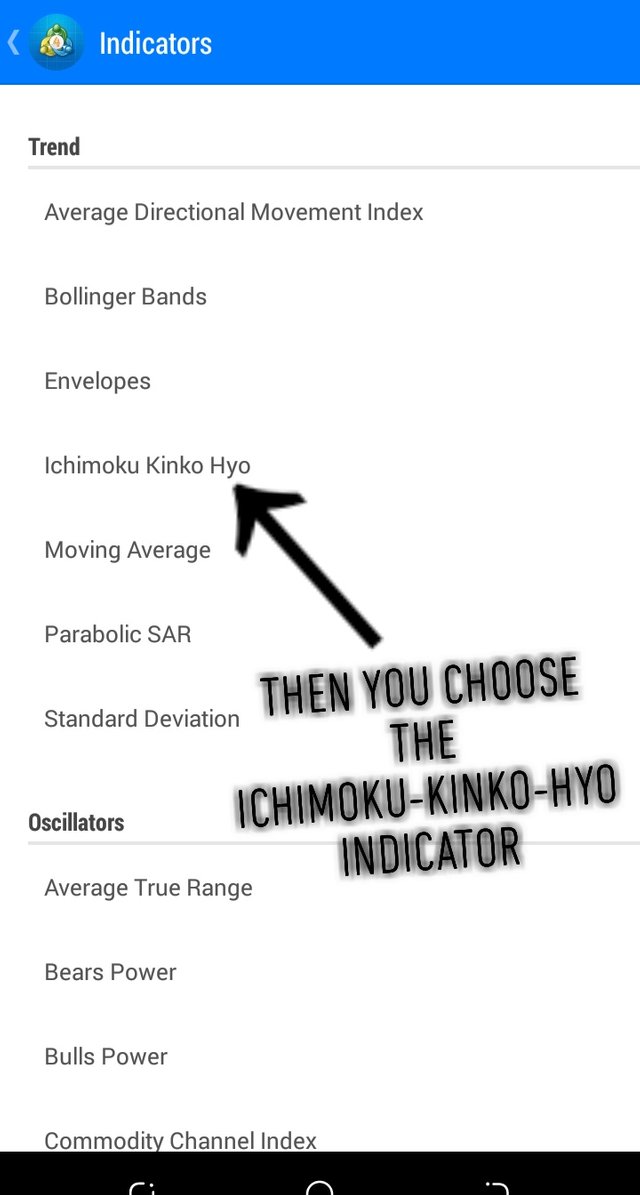
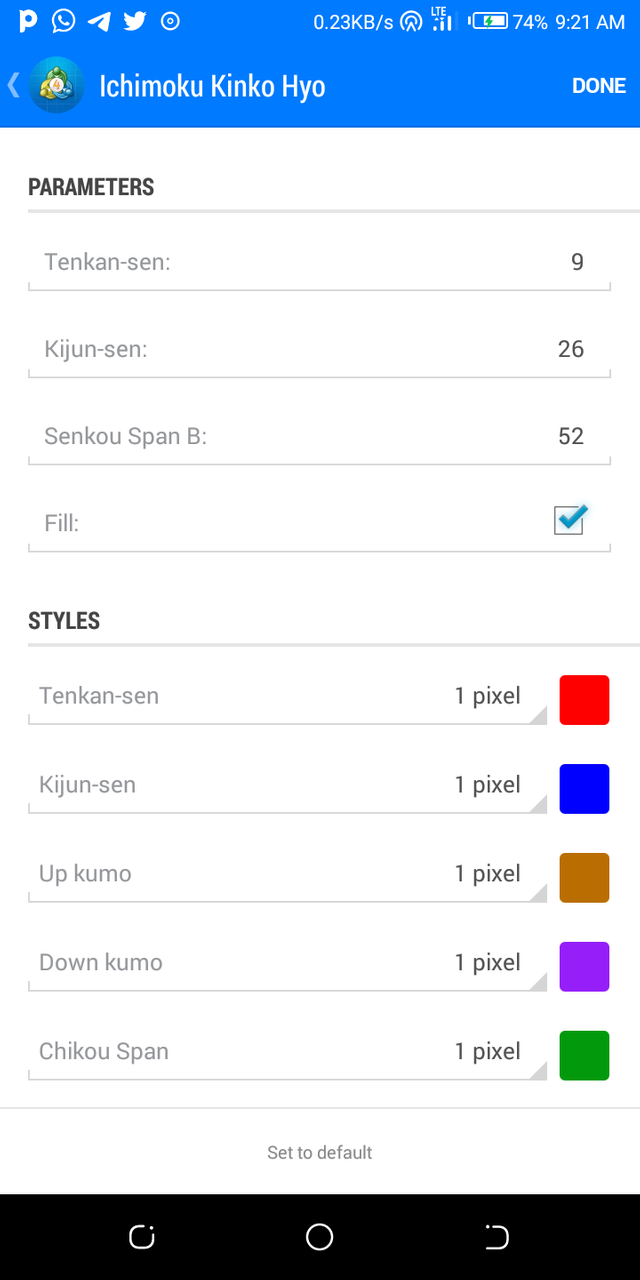
Screenshot from metatrader4 app
The Ichimoku-kinko-hyo Indicator default settings are
- Tenkan-Sen – 9days period(1 week and a half)
- Kijun-Sen – 26 days period (1 month)
- SENKOU SPAN A &B – 52 days period ( 2 months)
- CHIKOU SPAN– 26 days period (1 month)
How to use the Tenkan Sen line? How to use the Kijun Sen line? And How to use them simultaneously?
THE TENKAN SEN LINE
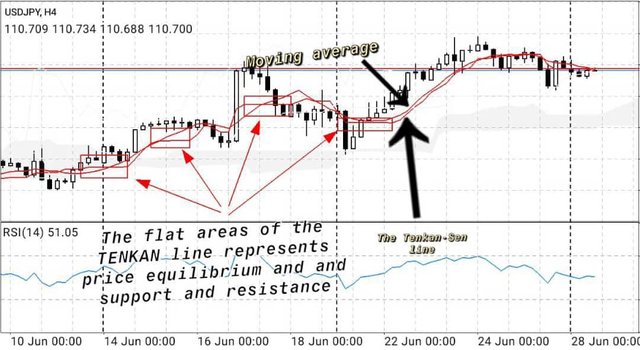
Some people will compare the TENKAN SEN LINE with the moving average whereas they are not the same . The TENKAN SEN LINE analyzes the price equilibrium and Support and resistance. While the moving average measures the price average closure. The tenkan line indicates a very strong support/ resistance point because the price doesn't really penetrate through the lines.
The TENKAN SEN LINE sometimes appears as a straight line . The tenkan line doesn't show any market trend at this point. It means it measures the average of the lowest and the highest points of the market.
To calculate the tenkan den line
Highest + lowest/ 2.
The Tenkan den line measures the market trend up to 9 days period so we can trust it 100% like every other indicator. When the price gets closer to the line it's indicating that a reversal might occur.
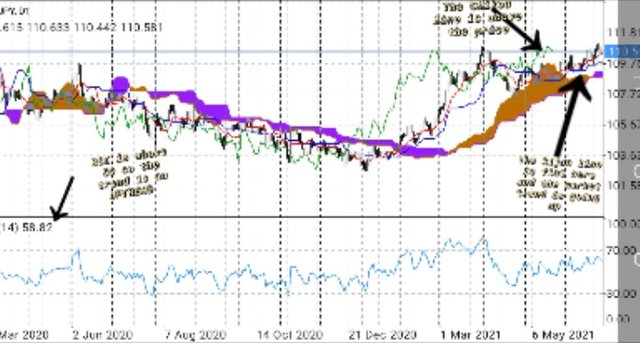
THE KIJUN SEN LINE
This line is one of the major/ strong line for the indicator. I would say it's one of the pillars of the Ichimoku-kinko-hyo Indicator. It's is same calculations with the tenkan line the. The main difference is they the Kijun-Sen line measures in a longer period, it measures the price in past 26days.
This is the same as the tenkan line the only difference is the period of time in which they measures. They gives the same date. But it is more reliable than the tenkan line because it analyses the short term trend, equilibrium is more accurate and the Support and resistance line are more trusted compared to the tenkan line.
The kijun line is the blue line. Here is another observation I observed
The kijun line also indicate strong Reversal trend. Which it's a very good trading signal.
Furthermore, the relationship between two line is when they cross each other, there will be a reverse/ change in the price trend. Since they are both indicating the same data studying the two together will be very good and we will get a stronger signal.
What is the chikou span line? And how to use it? And Why is it often neglected?
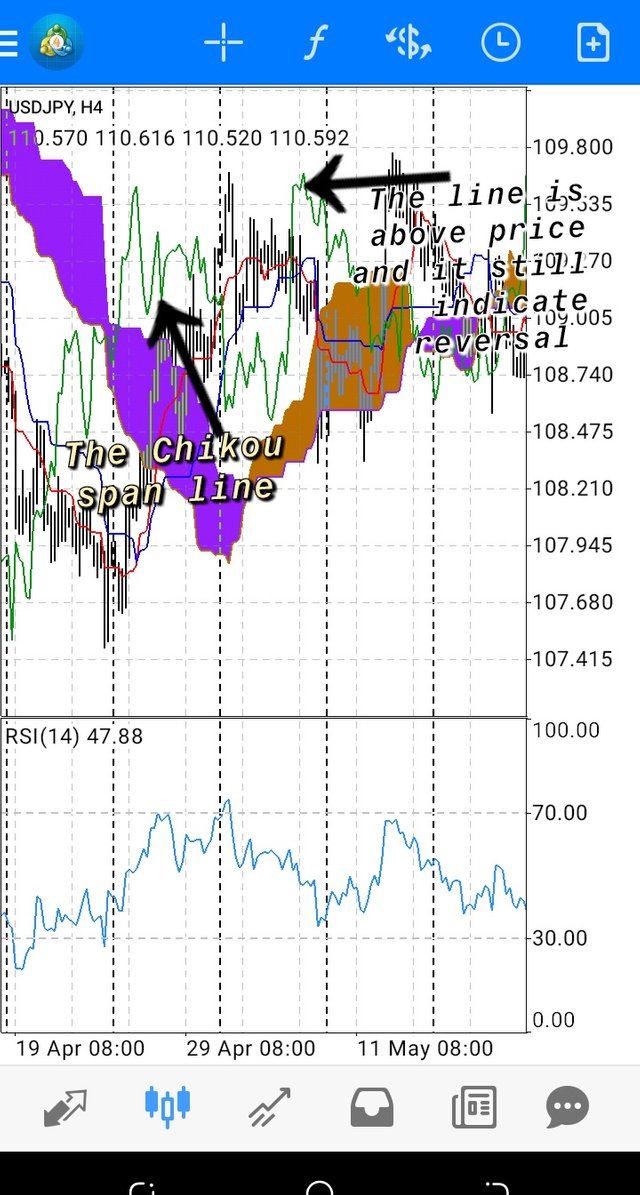
This line is commonly known as the lagging span. It is one of the lines that makes up the Ichimoku-kinko-hyo Indicator. It is calculated by Plotting closing prices 26 period behind latest closing price of the asset. This line gives relationship between current and prior trend, and it also indicate reversal trend.
When the Chikou span line is above the price the there will be an UPTREND, if it is below the price then there will be a downtrend. It should be used with other component of the Ichimoku-kinko-hyo Indicator because it's can't be trusted alone and can't be used alone to generate signal.
This is not useful when the price of the asset is not stable And the price is crossing the Chikou span steadily. The trend might still be there or the price is not steady. But other component of the Ichimoku-kinko-hyo Indicator will be considered. To give the actual price trend.
Considering this the Chikou span line is usually neglected because it doesn't give an actual signal. Sometime when the price crosses the Chikou span line it also signal reversal trend. So it can't be trusted.
What's the best time frame to use Ichimoku? And what is the best indicator to use with it?
The Ichimoku-kinko-hyo Indicator can be used on any time frame, if you are a scalper you can trade with the Ichimoku-kinko-hyo Indicator on a 1 minute time frame. And as for holders and swing traders they trade with the Ichimoku-kinko-hyo Indicator on a higher time frame. The time to use with the Ichimoku-kinko-hyo Indicator depend on the type of trader you are.
As we all know that we should no use a single indicator while trading because they are not 100% effective and the fail at times so we should support the indicator we are using with other reliable indicator also.
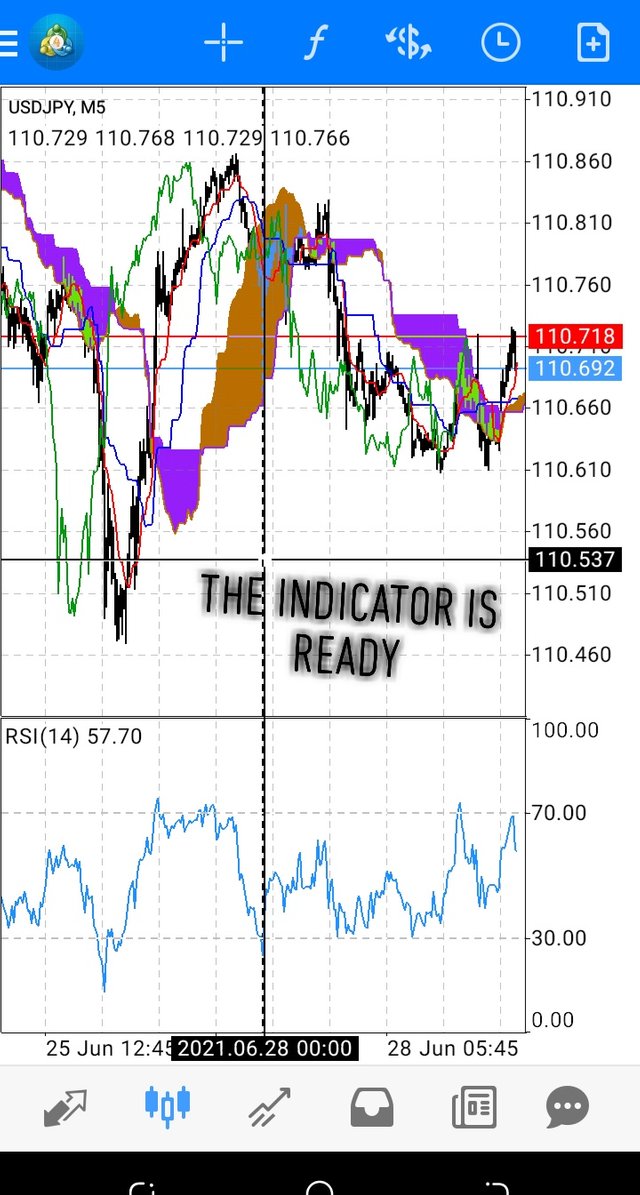
Since the Ichimoku-kinko-hyo Indicator is following the price trend we should support it with an indicator that's analysing volume. so we can analyse both the price trend and the volume together to get a better signal.
Looking at the above stated reason I will go with RSI indicator it can be used to support the Ichimoku-kinko-hyo Indicator to get a better signal. The RSI indicator analyses the the volume of the market so if we analyse it with the Ichimoku-kinko-hyo Indicator following the price action. Then we will get a better signal.
CONCLUSION
Briefly, the Ichimoku-kinko-hyo Indicator is a very unique indicator. There are 5 lines that make up the Ichimoku-kinko-hyo Indicator. Which are
- The Tenkan Sen line
- The kijun Sen line
- The Senkou Span A
- The Senkou Span B
- The Chikou Span.
These lines has different function they work together to make the Ichimoku-kinko-hyo Indicator a better one.
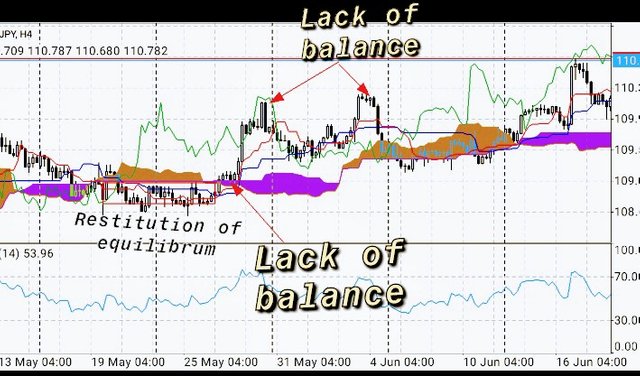
The Ichimoku-kinko-hyo Indicator gives us a strong resistance & support signal, it give area of price equilibrium where the price comes back to equilibrium after an uptrend or a downtrend.
The Ichimoku-kinko-hyo Indicator can be used to pick good entry and exit point while trading.
The Ichimoku-kinko-hyo Indicator aloe give a reversal signal.
CC @kouba01
Hello @vhenom,
Thank you for participating in the 1st Week Crypto Course in its third season and for your efforts to complete the suggested tasks, you deserve a 5.5/10 rating, according to the following scale:
My review :
Average work in general, given that your answer is limited to mentioning the information without delving into its analysis, which leads to the loss of the critical work.
You must explain these choices and give your opinion on changing the settings or not.
About the use of the Tenkan Sen and Kijun Sen lines simultaneously, it is one of the most common uses is the crossing of these two curves, indeed some scalpers interpret Ichimoku only through this crossing to detect signals of purchases or sales.
Thanks again for your effort, and we look forward to reading your next work.
Sincerely,@kouba01
Thanks for the review will do better next time
@tipu curate
Upvoted 👌 (Mana: 1/4) Get profit votes with @tipU :)
great post....
if you haven't got the 300 steem than get it now. i just claim my 300 steem 1 day ago. Vote for exnihilo.witness and get 300 STEEM. exnihilo.witness is a great guy he has a great past record for helping the community.
VISIT HERE TO KNOW MORE
Delete this or I will flag you