Steemit Crypto Academy: Season 2 Week 8 Course by @stream4u - Technical Indicator: Pivot Points
INTRODUCTION
Hello fellow steemians it's another week of the steemit Crypto Academy course. This course is all about Technical Indicator called Pivot Points thanks to @stream4u for bringing this type of indicator as a case of study.
Let's get started;
Discussed your understanding of Pivot Points.
Pivot Points is a Technical Indicator/ analysing tools for analysing the future movement of the market in respect to either resistance and support. The Pivot Points uses the high, low and closed levels of the previous chart to determine the movement of the market. The high is the resistance point while the low is the support point.
This technical indicators are used to calculate the total market trend over different time zone.
This analysing tools are usually used with the support and resistance combined. While using this indicator we mostly focus on the support and resistance level.
Futhermore, while using this indicator we predict the possible price movement from support level to resistance level. This indicator give us a better entry, takeprofit, and stoploss positions with the indicator. We know that if the market is in support it will rise to a higher level or breakout to a lower support level. This is the use of the Pivot Points. It determine all the support and resistance level in the market. Every possible points I guess.
Details about Pivot Point Levels.
The Pivot Points has seven point which are three resistance level R1,R2,R3 and three support level S1,S2,S3 and the main pivot level. That the standard Pivot Points but we can go ahead to add more to the levels by editing the indicator to our choice.
Main pivot level
This is the first line of Pivot Points. It indicates the starting point of the market chat when applied to the chart. It is always at the middle of the remaining six line/ positions of the Pivot Points. It the first to determine the trend of the market. If the candlestick goes down below the main pivot level then the trend will be bearish and if it goes above it there will be a bullish trend.
Resistance 1(R1)
This is the first resistance level of the Pivot Points if the candlestick get to the first resistance level the price can drop and get to the main Pivot level or the trend will breakout and hit resistance level 2
Resistance 2(R2)
This is the second resistance level of the Pivot Points if the candlestick get to this level the price can drop we can place a short order here and set our take profit to resistance level 2 or point below. And our stop loss will be resistance level 3. If the price breakout it will get to the resistance level 3 or it drops to lower point.
Resistance 3(R3)
This is the third resistance level of the Pivot Points if the candlestick gets to this level the price can drop to a lower level or the price will breakout to a higher resistance level.
Support 1(S1)
This is the first support level of the Pivot Points if the candlestick hit this level the market trend will bounce back to higher level / bullish trend or the price will breakout and hit lower support level
Support 2(S2)
This is the second support level of the Pivot Points if the candlestick hit this level the market trend will bounce back to higher level / bullish trend or the price will breakout and hit lower support level.
Support 3(S3)
This is the third support level of the Pivot Points if the candlestick hit this level the market trend will bounce back to higher level / bullish trend or the price will breakout and hit lower support level.
Pivot Point Calculation and R1 R2 S1 S2 Pivot Levels Calculation.
The Pivot Points are calculated base on high, low and close levels of the last day/ hour trading section.
- Main Pivot level = daily high +daily low +close ÷ 3
- Resistance 1(R1)= 2 × Pivot Points – daily low
- Resistance 2(R2) = Pivot Points + daily high - daily low
- Resistance 3(R3) = Daily High + 2×pivot point - daily low
- Support 1 (S1) = 2× Pivot Points – daily high
- Support 2 (S2) = Pivot Points – daily high – daily low
- Support 3 (S3)= Daily low – 2× daily high – pivot point.
This is how to calculate the Pivot Points.
How to Apply Pivot Point on Chart. (Screenshot with tag your name)
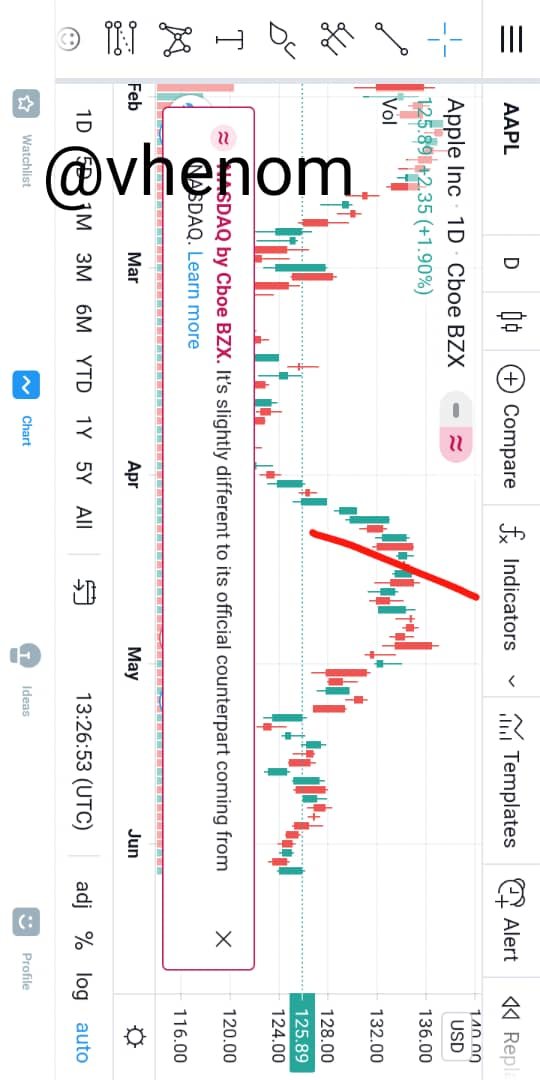
Now I will do a step by step method of how to add the Pivot Points to our chat on trading view. First after choosing the market I want to use this analysing tools for the I click on the indicator sign above the chart
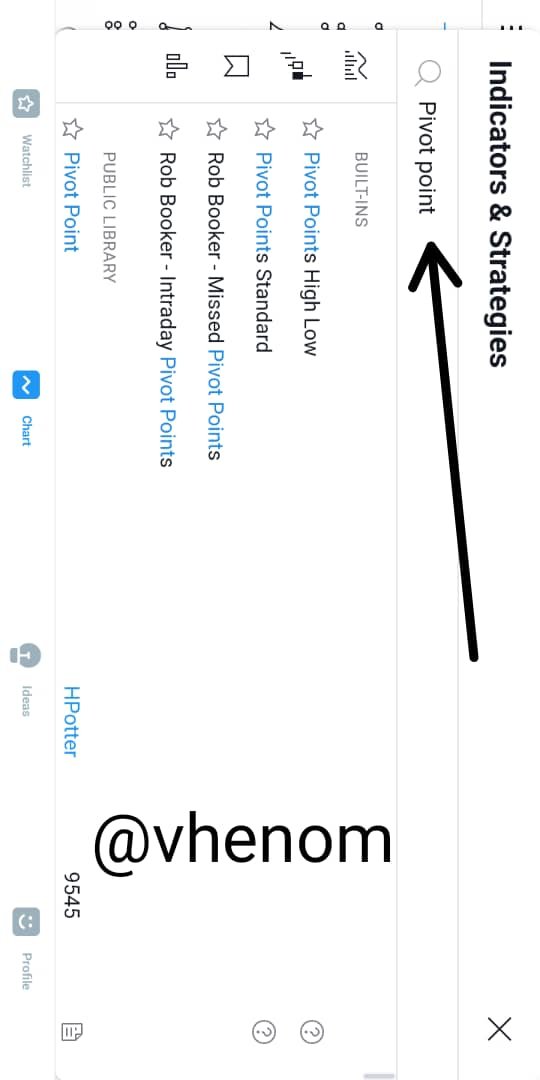
Then I searched for the Pivot Points here it is I bring all the options for me so I choose the Pivot Points standard
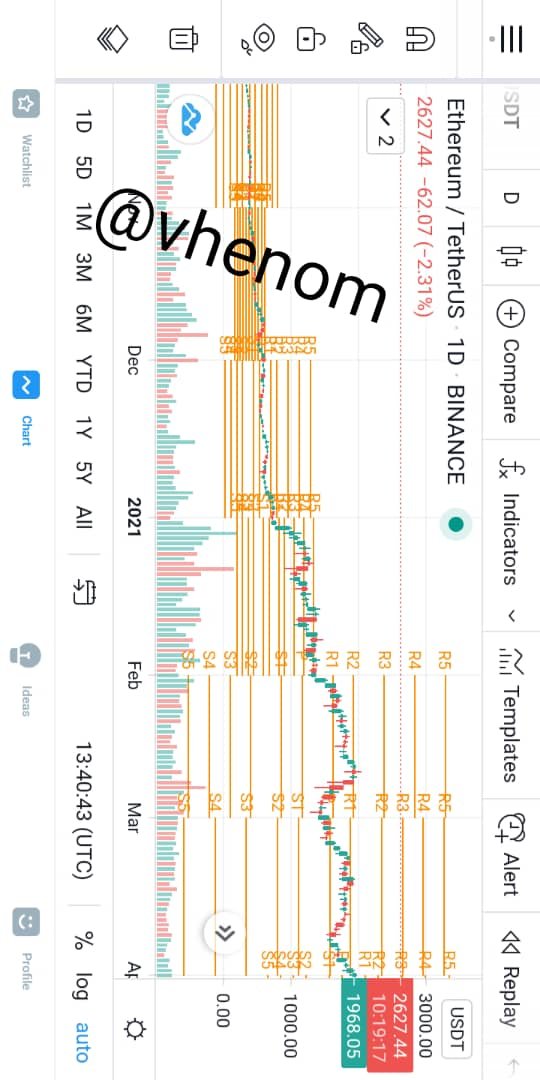
After clicking on the Pivot Points standard I added it to my chat like this
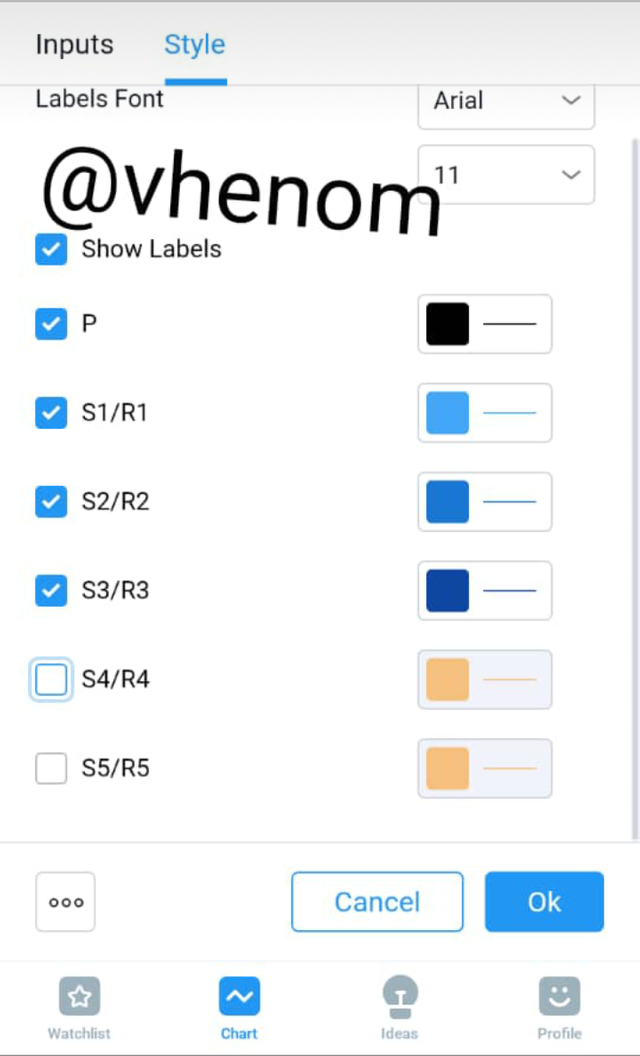
Then I went ahead to edit the indicator The other setting are okay just the number of resistance and support I have to reduce it to 3 by unmarking 4&5 and I changed the colors too

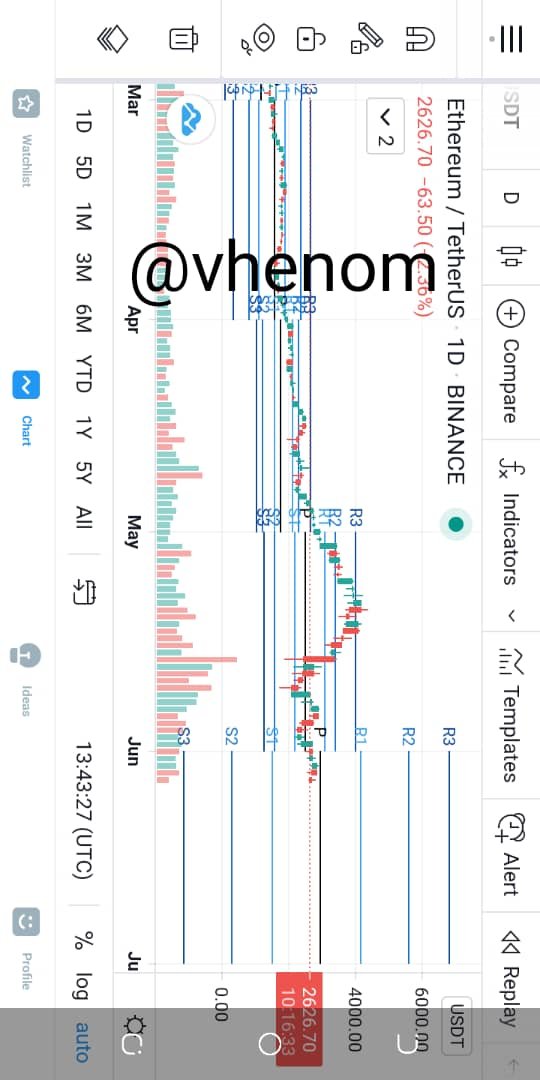
This is how it looks like after editing the indicator. We can start using it now.
How Pivot Points Work.
To trade with the Pivot Points we have to understand the strategy of the indicator there are just two possible moves here which are resistance or support and breakout. Meaning it's either the market trend bounce back for resistance and support or the trend breakout form the resistance and support.
We have to always apply stoploss to our trade to avoid making loss.
From the chart above we can see that the market have been observing both bullish and bearish trend and at some point there are also breakout at some point. We see that the price is above the the main Pivot level so the trend will be bullish based on the lecture. And the trend keeps going up. The next day price level was above the main pivot level so it's clear that the market trend will be bullish. And the . The price get above the first resistance level before bouncing back.
The next day the trend began above the main pivot level but a bearish trend begins the price falls from the resistance level one of yesterday's trend. The next day trend was bearish.
When the price got to support level 1 the price bounce back and hit the resistance level one in the next trend. That how the trend continues.
Base on this market movement we see that the trend is moving from resistance level back to support level continuously.
To trade with this trend we will place a long order when the trend is in Support level and set a stoploss at the Support level below and our take profit will be at the resistance level one. And if the market trend is in the resistance level 1 we can then place a short order/ sell and set our stop loss to the resistance level 2 and take profit will be support level one
Pivot Point Reverse Trading.
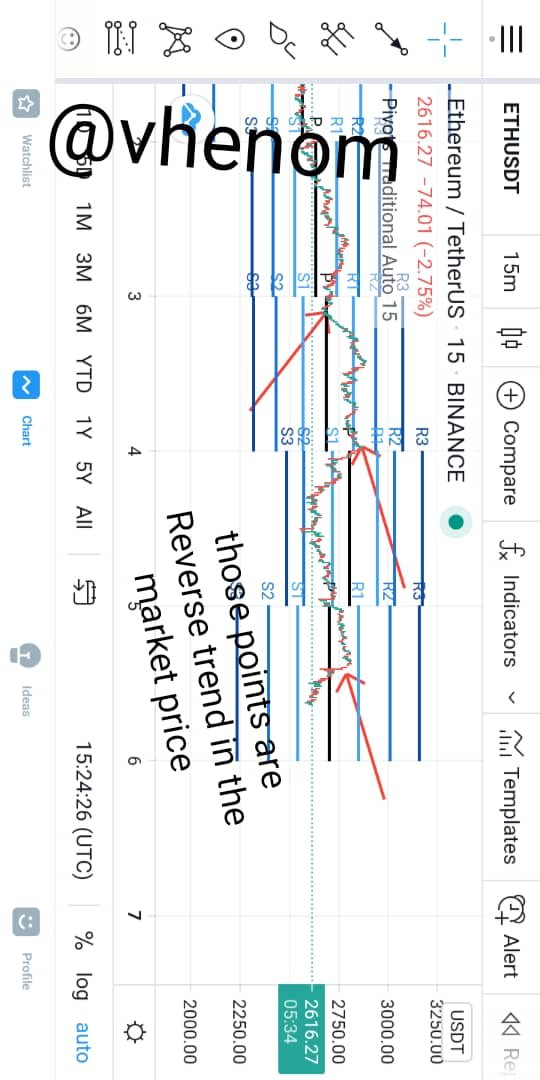
Pivot Point Reverse trading is when we take our position when the price action Reverse. The Reverse is simply the set back or when the market change directions either from being bullish to a bearish trend or vice versa.
From the above screenshot we see that once a reverse trend occur it change the price movement so when trading Reverse Strategy with the Pivot Points once the market about to Reverse it trend it the best time to buy/ sell depending on the trend before the reverse occur.
When trending Pivot Points Reverse trading when we see that the market price are in support level and a reverse is building up that the best time to buy or place a long order. It's also applicable to when the price in in resistance
Level we place a short order when a reverse trend is coming up and buyer will exist their positions.
What could be a common Mistakes in
Trading with Pivot Points
The greatest mistake greatest mistake that could happen when using the Pivot Points is when one use Pivot Points at the only indicator while trading. We must always remember that no indicator is 100% efficient so we still have to consider other indicators to support the Pivot Points
What could be the reasons For Pivot Points is Good.(Pros/advantages what's the time now
The Pivot Points is good indicator because it helps to predict the market trend almost accurately. With the use of the Pivot Points we can determine the possible movement of the market for the next day. The facts that he uses resistance and support makes it very good. With this indicator me can predict the resistance and Support position properly. When a breakout occur in price volume, we easily know the next Support / resistance point.
With the help of the Pivot Points Indicator we can trade in any time zone since it is determined by the high, low and close of the previous chat. So it easy to use the Pivot point in any time frame.
Apply the Pivot Points indicator in the Today chart (the day when you making this task) and set the chart for 15 minutes. Explain the market trend till the time of writing the task and how it will be next till the end of the day. You can give possibilities on both the side bearish and bullish.
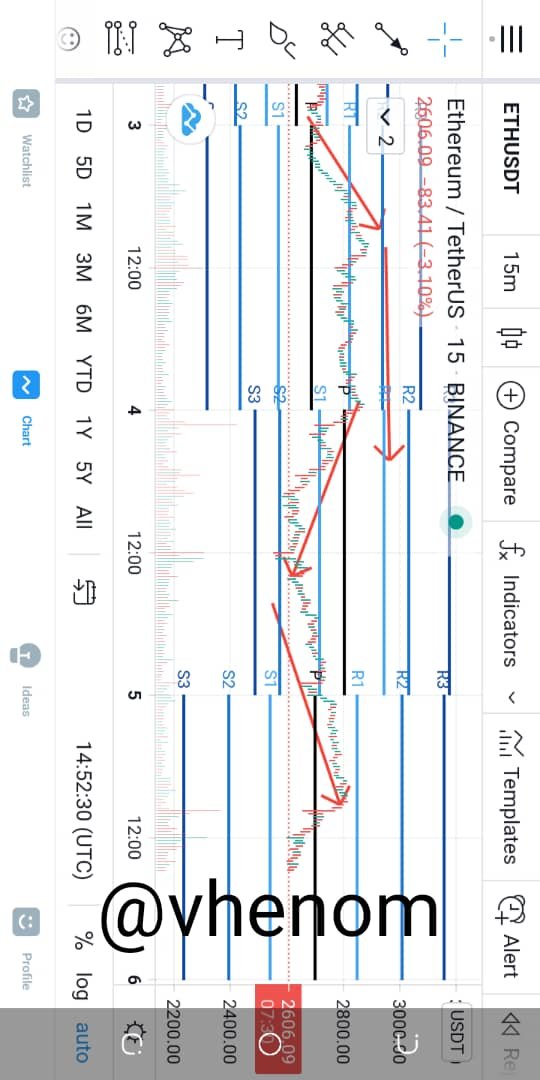
I will be using the ETHUSDT chart as a case of study. And as required I have set it to 15 min.
Base on the above chat today's trend start with a uptrend. If we check back to the previous chat we will see that this chat is in the uptrend phase it just left the accumulation state I hit support level one and bounce back. The trend continues in an accumulation state then I increase the trend base on the next day chart. It was going to hit the resistance level before the market reversed and we are experiencing another downtrend. Based on the market trend at the moment there is still possibilities that the market trend will hit the support level one
before bouncing back to hit the Resistance levels.
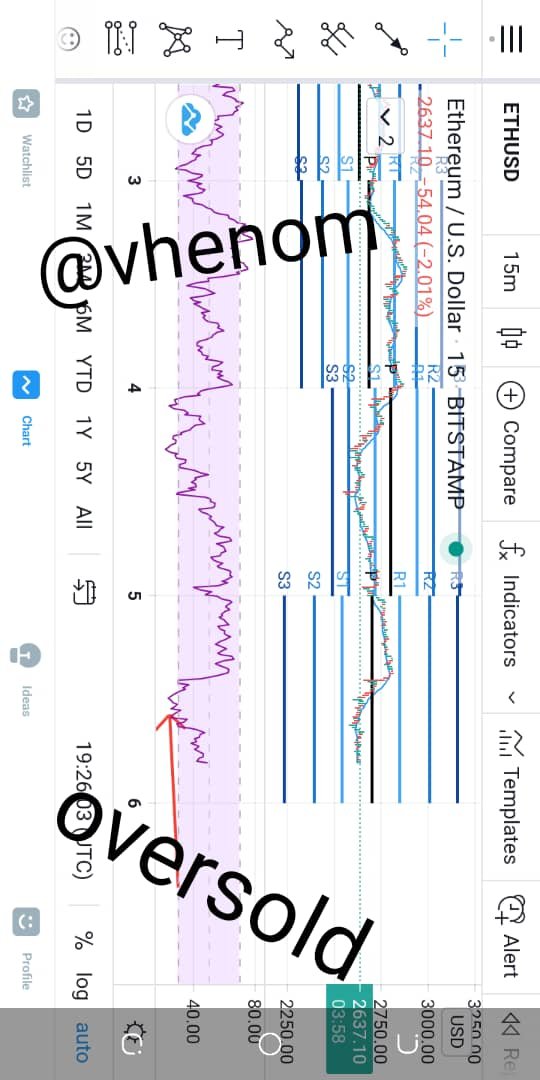
Looking at the supporting indicator RSI the we see that it's showing over sold signal which lead to the reverse trend in the market. But with This analysis there is possibilities that the market price will rise up to the 3rd resistance level.
Weekly Price Forcast For Crypto Coin: ETHUSDT(Based on all previous lectures of technical studies Forcast the Weekly price for any Crypto coin.
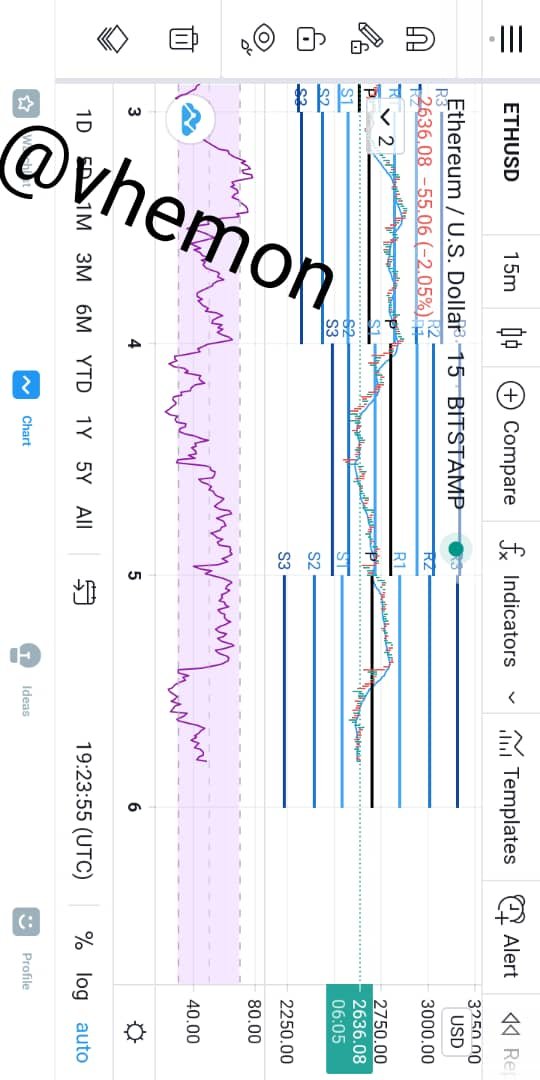
I will be predicting the price of ETHUSDT. Based on the fact that the ETHUSDT coin is the number 2 Crypto in the world and also has the second dominance after BTC. As we all know that the BTC cause the fall in the market based on its high dominance In the market.
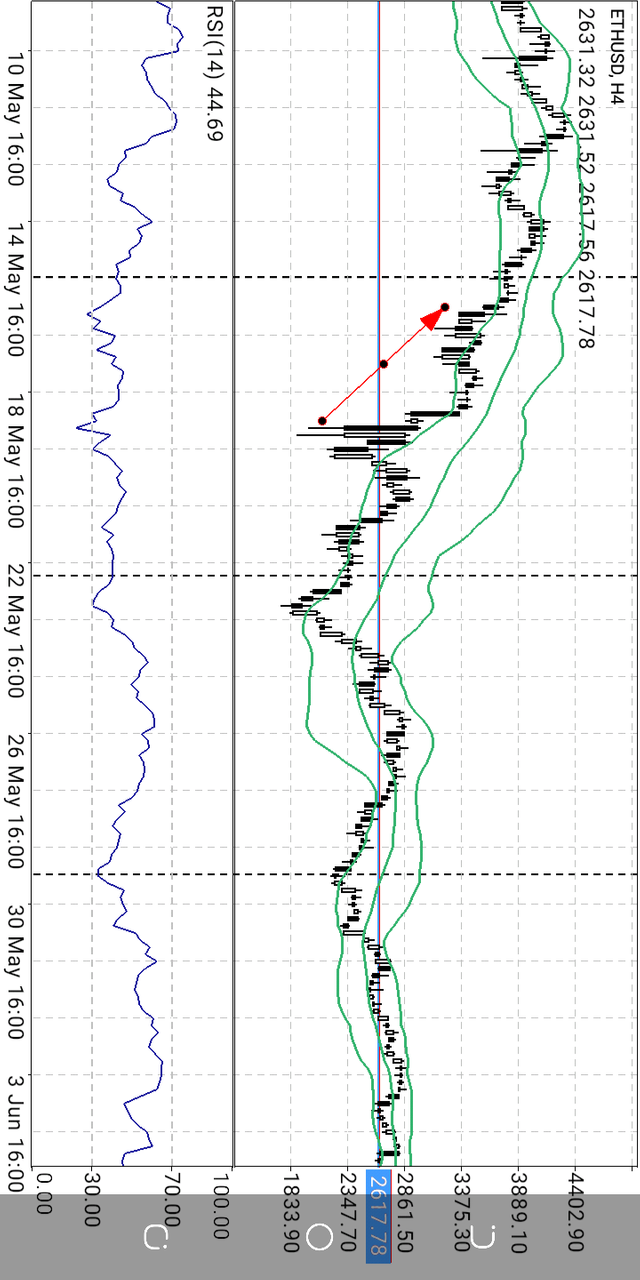
Base on this chart we can see that the eth is over bought the candlestick are breaking out of the Lower band constantly. This indicate that investors are buying the Eth aggressively. So we should expect a bullish trend anytime soon. The market is still in accumulation phase.
The RSI indicator is still below 50 so it's safe to start accumulating now.
In the next few weeks the ETHUSDT will take a bullish trend.
CONCLUSION.
The Pivot Points is a very good indicator. It's help predict the possible movement of the market trend through support and resistance levels respectively.
But like every other indicator the Pivot Points should not be used alone. It should be supported with other indicators. Since the Pivot Points is following the price trend we can Support it with the RSI indicator to read the volume of the market.
CC @stream4u
Hi @vhenom
Thank you for joining The Steemit Crypto Academy Courses and participated in the Homework Task.
Your Homework Task verification has been done by @Stream4u, hope you have enjoyed and learned something new.
Thank You.
@stream4u
Crypto Professors : Steemit Crypto Academy
#affable
Thanks for the review professor
Yes am using a mobile phone for my screenshot. Next time I will rotate it