Crypto Academy Week 2 Homework Post for (stream4u) - Candlestick Charts EN-TR
Hello Steemit Crypto Academy Community,
I follow courses given by Steemit academy professors. I have read, researched and prepared my homework for the 4 courses given this week. Next is the most difficult course, so I saved it for last. I have read thoroughly, researched and writing my homework. Our course instructor in this article is @stream4u.
Homework Scope: Steemit Crypto Academy | Course 2 | How to Read Candlestick Charts of Different Time Frames and Information on Buy-Sell (Support and Resistance).
One of the things that determines our trading positions on the stock markets is technical analysis. Trading will not be healthy without technical analysis. After combining fundamental analysis and technical analysis, we must make our decision.
I want to answer the questions of professor @stream4u one by one and complete my homework.
''1. Explain what is the meaning of the Green and Red candle and how to read the Green and Red candle, with candles image.(Screenshot Needed)''

Candlestick charts will provide us with comprehensive insight into what is happening in the cryptocurrency, one by one. Candles have two parts. The body consists of two parts, the tail. The tail is located at the top and bottom and looks like the wick of a candle. A green candlestick indicates that the stock market closing price is higher than the opening price. A red candlestick indicates that the stock market closing price is lower than the opening price. The tails you see at the ends of the red and green candles also show the highest or lowest prices of the day.
''2. Explain with Candle Chart, what are the time frames available that we can set into the chart, and why it needs to change the candle time frame? (Screenshot Needed)''

You can see both the red candle chart and the green candle chart in the picture. The red candlestick shows that the Steem price dropped too much that day. The closing price of the exchange was much lower than the opening price. On the green candlestick chart, the Steem closing price is higher than the opening price. We can say that the price of Steem rose to a good level that day.
There are many different time frames in candlestick charts.
There are candlestick charts of 1 minute, 3 minutes, 5 minutes, 15 minutes, 30 minutes, 45 minutes, 1 hour, 2 hours, 3 hours, 4 hours, 1 day, 1 week, 1 month.
It would be healthier to examine different time frames. Because the formations that we do not notice may appear in other time periods.
''3. Show any particular asset candle chart in a different time frame and explain in short what you see in the chart, like which trend we see, what are the price levels. (Screenshot Needed)''
15-minute EOS / USDT chart

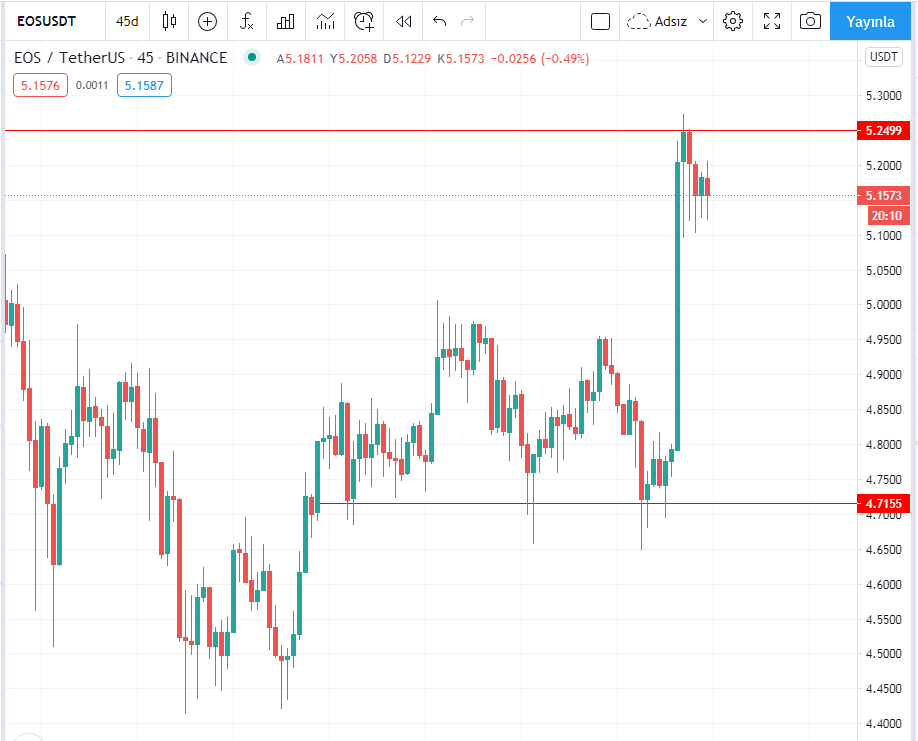
45-minute EOS / USDT chart
2-hour EOS / USDT chart

First of all, I can say that I am still very new to graphic reading. As I understand from the chart, the EOS / USDT chart is not a chart to be analyzed in short time frames. To invest in EOS, it is necessary to examine the charts with longer timeframes. I noticed a support zone at $ 4.58. Therefore, EOS is charged at this price. There is a resistance zone at $ 5.60. Therefore, it should also be sold from this region.
4. What type of traders available in the market, explain how they work?
There are 3 types of merchants.
Traders who plan long term. While making their plans, they plan by considering more than 1 day time frame. This can be for 1 week, 1 month or 1 year in most cases.
Short-term plan traders: They make their investments in a very short time frame. It is around 5, 15 minutes 1 hour. Often risky choices.
Traders who do not observe any time frame: traders who resist this group do not act according to any time frame. They want to take advantage of rapid price changes. Of course, such an opportunity does not always appear.
''5. In trading or investing in assets, what is the importance of Support and Resistance, explain how they work?''
Resistance and support levels are important when investing. Support is located below the price level of an asset and prevents it from falling. When the price drops below the support zone, the term support is broken. Resistance is also the opposite. It is above the price level of an asset and prevents the price from rising. When the support and resistance levels are broken, new support and resistance levels emerge. Support and resistance levels are important. Because it allows us to plan ahead for trading. It allows us to predict price changes. It helps us to create a clear picture of the market.
'' 6. How we can find the Support in the candle chart, explain with one of the asset Candle charts with screenshot and point the levels. (Screenshot Needed)''

The levels that the price has difficulty in falling below or in pulling above the price are determined from the charts. The places where the price cannot go below are expressed as support, and where the price cannot go above it is expressed as resistance. If these levels of resistance and support struggle when not broken, it means that those levels are very strong.
The regions I marked in green in the picture are support areas. Because the green candles on the left and right of the red candle are longer than the red candle. Therefore, this region is the support zone. The area I marked in red is the resistance zone. Because the red candles on the right and left of the green candle are longer than the green candle.
''After finding Support, when and where we need to place a buy order, explain with a chart screenshot? (Screenshot Needed)''

As you can see in the picture I found a support zone at $ 0.373. We can place a buy order if the price has descended towards those regions, if there is enough volume, and there is positive news about the stock or cryptocurrency. It would be more beneficial on our behalf if we place the purchase order slightly above the support zone.
Türkçe
Merhaba Steemit Crypto Akademi Topluluğu,
Steemit akademi profesörleri tarafından verilen kursları takip ediyorum. Bu hafta verilen 4 kursun yazılarını okudum, araştırdım ve ev ödevimi hazırladım. Sırada en zor olan kurs var, o yüzden onu en sona sakladım. İyice okudum, araştırdım ve ev ödevimi yazıyorum. Bu yazımızdaki kurs hocamız @stream4u.
Ödev Görev Konusu: Steemit Crypto Academy | Kurs 2 | Farklı Zaman Dilimlerindeki Mum Grafikleri Nasıl Okunur ve Satın Al-Sat Hakkında Bilgi (Destek ve Direnç).
Borsalarda alım satım pozisyonlarımızı belirleyen şeylerden biri de teknik analizdir. Teknik analiz olmadan alım satım yapmak hiç sağlıklı olmayacaktır. Temel analiz ile teknik analizi birleştirdikten sonra kararımızı vermeliyiz.
Profesör @stream4u'nun sorularını tek tek yanıtlayıp ödevimi tamamlamak istiyorum.
''1. Yeşil ve Kırmızı mumun anlamını ve Yeşil ve Kırmızı mumun nasıl okunacağını mum görüntüsü ile açıklayın. (Ekran Görüntüsü Gerekli)''
Mum grafikleri bir bir hissede, kripto parada ne olup bittiği konusunda bize kapsamlı bir bilgi sağlayacaktır. Mumların iki kısmı vardır. Gövde, kuyruk olmak üzere iki kısımdan oluşur. Kuyruk kısmı alt ve üst tarafta bulunur ve mumun fitili gibi gözükür. Yeşil bir mum çubuğu borsa kapanış fiyatının açılış fiyatından yüksek olduğunu gösterir. Kırmızı bir mum çubuğu borsa kapanış fiyatının açılış fiyatından daha düşük olduğunu göstermektedir. Kırmızı ve yeşil mumların uçlarında gördüğünüz kuyruklar da gün içindeki en yüksek ya da en düşük fiyatları gösterir.
''2. Mum Grafik ile açıklayın, tabloya koyabileceğimiz mevcut zaman dilimleri nelerdir ve mum zaman çerçevesini neden değiştirmesi gerekir? (Ekran Görüntüsü Gerekiyor)''
Resimde hem kırmızı mum grafiğini hem de yeşil mum grafiğini görmektesiniz. Kırmızı mum grafiğinde o gün Steem fiyatının çok fazla düştüğünü gösteriyor. Borsanın kapanış fiyatı, açılış fiyatından çok daha düşük olmuştur. Yeşil mum grafiğinde ise Steem kapanış fiyatı açılış fiyatından daha yüksektir. O gün Steem fiyatı iyi denebilecek kadar yükselmiştir diyebiliriz.
Mum grafiklerinde çok farklı zaman dilimleri vardır.
1 dakikalık, 3 dakikalık, 5 dakikalık, 15 dakikalık, 30 dakikalık, 45 dakikalık, 1 saatlik, 2 saatlik, 3 saatlik, 4 saatlik, 1 gün, 1 hafta, 1 aylık mum grafikleri vardır.
Farklı zaman dilimlerini incelemek daha sağlıklı olacaktır. Çünkü farkedemediğimiz formasyonlar diğer zaman dilimlerinde ortaya çıkabilir.
''3. Herhangi bir belirli varlık mum grafiğini farklı bir zaman diliminde gösterin ve grafikte gördüklerinizi kısaca açıklayın, örneğin hangi eğilimi gördüğümüz, fiyat seviyelerinin ne olduğu gibi. (Ekran Görüntüsü Gerekiyor)''
Öncellikle grafik okuma konusunda henüz çok acemi olduğumu söyleyebilirim. Grafikten anladığım kadarıyla EOS /USDT grafiği kısa zaman dilimlerinde incelenecek bir grafik değil. EOS'a yatırım yapmak için daha uzun zaman dilimli grafikleri incelemek lazım. 4.58$'da bir destek bölgesi farkettim. Dolayısıyla bu fiyattan EOS alınır. 5.60$'da direnç bölgesi var. Dolayısıyla bu bölgeden de satılmalı.
''4.Piyasada ne tür tüccarlar mevcut, nasıl çalıştıklarını açıklayın?
3 çeşit tüccar vardır.
Uzun vadeli plan yapan tüccarlar. Bunlar planlarını yaparken 1 günlük zaman diliminden daha fazlasını düşünerek plan yapar. Bu çoğu zaman 1 hafta, 1 ay ya da 1 yıl olabilir.
Kısa vadeli plan tüccarlar: Bunlar yatırımlarını çok kısa zaman dilimi içerisinde yapar. 5, 15 dakika 1 saat civarındadır. Genellikle risklidir tercihleri.
Herhangi bir zaman dilimi gözetmeyen tüccarlar: bu gruba diren tüccarlar, herhangi bir zaman dilimine göre hareket etmez. Hızlı fiyat değişimlerinden yararlanmak isterler. Tabii böyle bir fırsat her zaman karşılarına çıkmaz.
''5. Varlıklara yatırım yaparken veya yatırım yaparken Destek ve Direncin önemi nedir, nasıl çalıştıklarını açıklayın?''
Yatırım yaparken direnç ve destek seviyeleri önemlidir. Destek, bir varlığın fiyat seviyesinin altında bulunur ve düşmesine engel olur. Fiyat destek bölgesinin altına düştüğü zaman destek kırıldı tabiri kullanılır. Direnç de tam tersidir. Bir varlığın fiyat seviyesinin üstündedir ve fiyatın yükselmesine engel olur. Destek ve direnç seviyeleri kırıldığında yeni bir destek ve direnç seviyeleri ortaya çıkar. Destek ve direnç seviyeleri önemlidir. Çünkü alım-satım için önceden plan yapmamızı sağlar. Fiyat değişimleri konusunda öngörüde bulunmamızı sağlar. Piyasanın belirgin şekilde bir görüntü oluşuması konusunda bize yardımcı olur.
''6. Desteği mum grafikte nasıl bulabiliriz, mum grafiklerinden biriyle ekran görüntüsü ile açıklayabilir ve seviyeleri işaret edebiliriz. (Ekran Görüntüsü Gerekiyor)''
Grafiklerden fiyatın altına inmekte zorlandığı ya da fiyatın üstüne çekmekte zorlandığı seviyeler tespit edilir. Fiyatın altına inemediği yerler destek, fiyatın üstüne çıkamadığı yerler direnç olarak ifade edilir. Bu direnç ve destek seviyeleri kırılmadıkta zorlanması, o seviyelerin çok güçlü olduğu anlamı taşır. Resimde yeşil ile işaretlediğim bölgeler destek bölgeleri. Çünkü kırmızın mumun solunda ve sağında yer alan yeşil mumların boyu kırmızı mumdan daha uzundur. Dolayısıyla bu bölge destek bölgesidir. Kırmızı renk ile işaretlediğim bölge direnç bölgesidir. Çünkü yeşil mumun sağında ve solunda yer alan kırmızı mumların boyu, yeşil mumdan daha uzundur.
**'' 7. Desteği bulduktan sonra, ne zaman ve nerede bir satın alma siparişi vermemiz gerektiğini bir grafik ekran görüntüsü ile açıklayalım mı? (Ekran Görüntüsü Gerekiyor)''
Resimde gördüğünüz gibi 0.373$ seviyesinde bir destek bölgesi buldum. Fiyat o bölgelere doğru inmişse, yeterince hacim oluşmuşsa ve hisse ya da kripto para ile ilgili olumlu haberler varsa alım siparişi verebiliriz. Alım siparişini verirken destek bölgesinin biraz üstünden vermemiz bizim adımıza daha faydalı olur.
Hi @tht
You made a good post on Homework task 2, explained it very well.
I like the below 2 points, well said.
Thank You For Showing Your Intrest in Steemit Crypto Academy
You have completed the homework task and made a good post, explained very nicely about How To Read Candlestick Charts In Different Time Frame & Information about Buy-Sell(Support & Resistance).
Remark: Homework Task Completed.
Thank You.
@stream4u
Crypto Professors : Steemit Crypto Academy
Thanks prof.
Twitter sharing
https://twitter.com/Steemtht/status/1362741553953964037