Crypto Academy Season 2 Week 8 Homework Post for (@stream4u) - Technical Indicator: Pivot Points
Professor @stream4u this week detailed one of the technical indicators traders often use, the Pivot Point. It is a very easy and practical indicator to use.

1.Discussed your understanding of Pivot Points. (Title For this topic will be Pivot Points)
Pivot points are one of the indicators used in the technical analysis of cryptocurrencies. It is among the indicators that are very useful and easy to implement. It is used to determine possible support and resistance levels in the price movements of cryptocurrencies and to give an idea to the traders.
This indicator is used to identify significant support and resistance levels after minor price movements in the market. That's when traders use this indicator to guide them after minor price movements in the market.
Especially these days, the market is stagnant and there is no big fluctuation in price movements. Traders can apply the indicator to cryptocurrency charts very easily.
Above pivot points create buy signals for traders. Conversely, the bottom of the pivots creates a sell signal for traders. Traders start to make their moves by considering these points.
Experienced traders do not use this indicator alone. Because no indicator always gives accurate signals. Their security makes their move by applying this indicator to the chart along with other indicators.
Pivot points are determined by the previous day's low, high and closing price.

2.Details about Pivot Point Levels.
Support and resistance levels are used when determining pivot points. When the Pivot Point is applied to the charts, the Main Pivot Point level is in the middle.
Above the main Pivot Point are the Resistance levels. Like Resistance Level 1, Resistance Level 2, Resistance Level 3. Below the main Pivot level are support levels. Like support level 1, support level 2, support level 3.

Main Pivot Level: The closing is the average of the lowest and highest price. It is located in the middle of support and resistance levels.
Support Level 1 (S1): This is the first support level below the Main Pivot level.
Support Level 2 (S2): Located below the main Pivot level and the initial resistance level.
Support Level 3 (S3): It is the support level below the main pivot level and the 2nd support level.
Resistance Level 1 (R1): It is the first resistance above the main pivot level.
Resistance Level 2 (R2): It is the resistance level above the main pivot level and the initial resistance.
Resistance Level 3 (R3): It is the resistance level above the main pivot level and the 2nd resistance level.
3.Pivot Point Calculation and R1 R2 S1 S2 Pivot Levels Calculation.
Once we learn how pivot levels are calculated, it will give us a better understanding of the Pivot Point indicator.
When calculating the pivot level, the asset price is averaged over the previous day's high, low and closing price. Let's say $0.6, $0.33, $0.5 in order of these prices. We add these 3 prices (0.6+0.3+.05) then divide by 3. The result ($0.466) is the Pivot level.
While doing other calculations, I will continue with the prices I gave as examples.
Resistance 1 (R1): Subtracting the daily lowest price from twice the point level. ( 0.466 * 2)- 0.3 = $0.633
Resistance 2 (R2): We collect the daily highest and lowest price difference by Point level. (PP+ (H-L) = (0.466+ (0.6-0-3) = $0.766
Support 1 (S1):Subtracting the daily high price from twice the pivot level. ($0.466*2)- ($0.6) = $0.333
Support 2 (S2):We find the Pivot Point level by subtracting the daily high and low price difference. ($0.6- ($0.6-$0.3) = $0.3
After these calculations, we can make the following order.
Resistance 2 >Resistance 1 > Main Pivot Point > Support 1 > Support 2
4.How to Apply Pivot Point on Chart. (Screenshot with tag your name)
I am using Tradingview to apply the indicators on the chart.

- I will choose the ADA /USDT pair. My chart is 15 minutes. I click "fx" to apply the Pivot Point indicator to the chart.

(tradingview ADA/USDT chart)
- First I chose the Candlesticks pattern. Then I searched for "Pivot Point". If I choose the Pivot Points standard, the indicator will be applied to the chart.

- I applied the Pivot Point indicator to the chart. Main Pivot level in the middle. There are resistance levels on the upper side and support levels on the lower side.

- There are 5 different types of Pivot Point indicator. You can use other types from the first marked place. I marked the timeframe auto and the pivot number as 15.

- When we click on the style section, there is the font and size.
I reduced the number of support and resistance to 3 (for convenience with our lesson). I unchecked R4/S4 and R5/S5. We can choose the P, R1/S1, R2/S2 and R3/S3 levels in any color we want.
5.How Pivot Points Work. (Screenshot with tag your name)
Earlier I said how pivot points are calculated. Pivot points remain fixed when applied to the chart. If the asset price is above the main pivot point, it indicates that the asset price will go up. On the contrary, if the asset price is below the main pivot point, it indicates that the asset price will decrease. Traders determine a strategy accordingly.
(tradingview ADA/USDT chart)
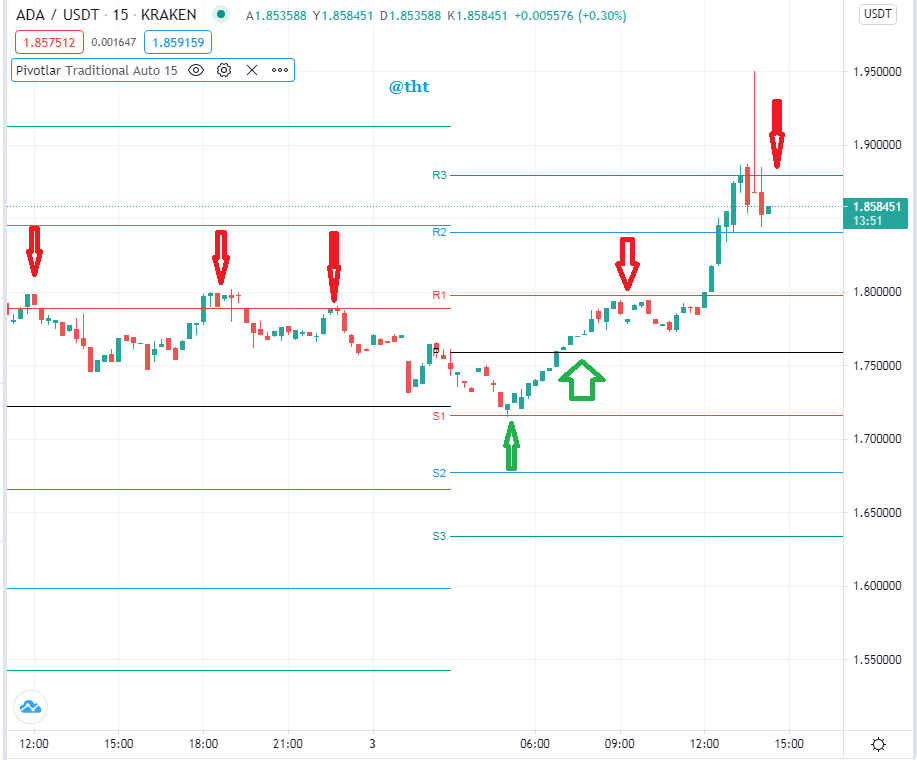
As you can see from the screenshot, the graphic is two days old. On the first day, the asset price remained above the main pivot level. When the asset price reaches the R1 level, it begins to decline. Buy when the asset price is at the Main pivot level and sell when it reaches the R1 level. As you can see, the asset price was not effective enough against the R1 level and the asset price started to decline.
On the 2nd day, the asset price remained below the main pivot level and the asset price decreased for a while. The asset price has respected the S1 level and the asset price has started to increase. The price has risen well and started to exceed the main pivot level. The asset price first returned from the R1 level and then continued to rise again. Strong reception also forced the R2 level. For a short time, the price fell, respecting the R2 level, but continued to rise again. R3 level is a stronger level. Although the asset price exceeded the R3 level for a while, the asset price fell below the R3 level.
We can see that the ADA price is respecting the R1, S1 and R1,R2, R3 levels. This is especially evident in the chart on the first day. We may be wrong on the chart during periods of strong buying/selling. To avoid this situation, we should use Stoploss.
S1, S2, S3 levels are suitable for buying, R1, R2, R3 levels are suitable for selling. If the asset price exceeds the main pivot level, the uptrend begins. If the asset price moves down from the main pivot level, the decline starts.
6.Pivot Point Reverse Trading. (Screenshot with tag your name)
In our previous courses, we learned what Reverse Trading is and how it works. No entity on earth increases or declines forever.
Assets begin to decline after long-term (hard) increases. On the contrary, assets start to increase after a long (hard) decline. Buying after assets have fallen too low or selling after assets have risen too much gives us good profits.
I'll look at the ADA/USDT chart I used in this tutorial and show you the appropriate places for reverse trading.

(tradingview ADA/USDT chart)
The chart covers a 2-day trend. It is also a 15-minute candlestick chart. ADA price is above the Main Pivot level on the first day. ADA price rises for a while and then encounters the R1 level. And the price is starting to drop. Here, it is necessary to sell ADA or open a short position.
The ADA price fell a lot on the 2nd day. ADA price is below the Main Pivot level. This is the region where the fall occurs. We know that the fall will not happen forever. A buying opportunity emerges in the region of S1 level. Asset price begins to rise. Experienced traders will find a good buying opportunity here. Here we have to buy or open a long position.
As you can see in the screenshot, the ADA price has respected the R1 and S1 levels, thus changing the direction of the trend.
7.What could be a common Mistakes in Trading with Pivot Points
Traders can make a lot of mistakes when using this indicator. I would like to make some suggestions against the mistakes that traders will make.
First of all, I have to say that no indicator gives a 100% correct signal. In strong buying and strong selling, we can see that the R1 and S1 levels do not respect this.
When using the pivot point indicator, it must be combined with other indicators. Then we have to make our move.
The Pivot Point indicator is one of the indicators that should be used daily. We should use it to make intraday profits, long-term moves can mislead us.
We should not make any moves when it approaches the main Pivot level. We should try to understand the direction of the trend thoroughly.
We should sell when the asset price drops below the main pivot level. We should buy when the asset price rises above the main pivot level. We should use stop loss while making these moves.
After making enough profits, we should make our move. Too much greed will cause you to lose your profits or even hurt you.
When we apply the Pivot Point indicator, we have to check the volume of the asset price frequently. When we sense an anomaly, we should either withdraw from the market or try to understand the direction of the trend.
8. What could be the reasons For Pivot Points is Good.(Pros/Advantages)
Pivot Points is a commonly used indicator. Most intraday traders use this indicator.
Therefore, traders will make moves based on the levels in the indicators. If everyone makes the same move at the same time, it will bring success. For example, imagine that each trader will start selling at the R1 level. On the contrary, consider that every trader using this indicator is buying at the S1 level. Thus, the direction of the trend will be determined by the traders using this indicator. Therefore, since it is a frequently used indicator, the success rate of the indicator increases.
The Pivot Point indicator calculates the prices of the previous day. Therefore, it will be easier to determine the direction of the trend and to identify the support resistance points. Using up-to-date data will increase the success of traders.
It is one of the easiest to understand indicators. So even the most novice trader can use this indicator.
The Pivot Point indicator has multiple support and resistance zones. Therefore, it will help us determine the direction of the trend.
It is compatible with other indicators and increases success when used together.
9.Apply the Pivot Points indicator in the Today chart (the day when you making this task) and set the chart for 15 minutes. Explain the market trend till the time of writing the task and how it will be next till the end of the day. You can give possibilities on both the side bearish and bullish.
It covers a 15-minute candlestick chart and a 2-day trend. I chose the Steem /USDT chart because it is of great interest to us.

(tradingview Steem /Usdt chart)
Steem price started to rise as it broke above the Main Pivot level on the first day. Then it remained horizontal for a while. It fell slightly above the main pivot level, and rose slightly above it.
Today, however, it went well above the main pivot level and faced resistance R1. R1 respected the resistance and the price started to drop. However, it managed to stay above the main pivot level. It just slipped down before approaching the R1 level.
I think Steem price will decrease a little towards the end of the day. The price drop will be more severe when it falls below the main pivot level.
Currently Steem price is $ 0.570 . The price at the main pivot level is $0.559. I think the Steem price will drop to the S1 level. The price at the S1 level is $0.538. Steem can see this price by the end of the day, then it will respect the S1 level and rise.
Upward could be like this. Steem price came close to the R1 resistance many times today but failed to exceed it. Unless there are strong purchases, the Steem price can go as high as $0.586 by the end of the day.
10.Weekly Price Forcast For Crypto Coin: DogeCoin
The cryptocurrency I want to examine in detail this week is Dogecoin.
Basic information about Dogecoin.
Dogecoin was invented and launched in 2013 by Billy Markus and Jackson Palmer. As it is known, new blockchains begin to form as a result of hard fork in blockchains. Dogecoin is also a Litecoin fork. They are basically similar but differ in transfer rate and rewards per block. The circulating supply and the total supply also differ. There is no limit to the total supply.
Block creation time in Bitcoin is on average 10 minutes. In Dogecoin, the block creation time is 1 minute. Therefore, transfers occur faster than Bitcoin.
It has been used as a tip to reward quality content on platforms such as Reddit and Twitter.

(coinmarketcap screenshots)
There are currently 129.87B DOGEs in the market.
Currently 1 Doge = $0.405
Total market cap $52,598,111,716
Coinmarketcap rank: 6
The reason I would like to predict the Dogecoin.
Dogecoin has become quite popular in the last 1 year. With this popularity, it managed to be among the top 10 cryptocurrency projects. The constant praise of Tesla CEO Elon Musk and NBA team Dallas Mavericks by the owner has created an explosion in the price of Dogecoin.
Dogecoin price has increased hundreds of times compared to the last 1 year. It has become so popular that Coinbase, one of the popular exchanges, wanted to list Dogecoin. A few days ago, there was a significant increase in dogecoin prices as a result of Coinbase's listing. Since the market has been very flat in the last period, it actually prevented the real increase. The daily volume of Dogecoin is quite high and this is very interesting to me.
1 week technical analysis of Dogecoin

(tradingview Doge/Usdt chart)
There has been a price increase in Dogecoin in recent days. This is because it is listed on an exchange like Coinbase. In such important news, the asset price can easily exceed the resistance points. As you can see in the screenshot, Dogecoin price rose from $0.316 to $0.447. It is important that it rises up to this price by overcoming all the important resistance points.
My upside prediction:
The current Dogecoin price is $0.405. And there is a support level here. If it can hold here, the price will go up. It could break the resistance at $0.447 and continue higher. It is sometimes difficult to evaluate it in terms of technical analysis, as Dogecoin is constantly manipulated by powerful actors. I see the highest price that Dogecoin can rise in 1 week is $ 0.447.
My downside prediction:
Dogecoin could experience a bearish dip. Because the daily volume in the last period has decreased a bit and this indicates that it will operate in the opposite direction of the trend. Dogecoin could drop as low as $0.316 if the hard selling pressure comes to work. This is quite possible. therefore, I do not find it correct to buy Dogecoin at its current price. If it drops as low as $0.316 it can be bought there. I see the lowest price that Dogecoin can drop in 1 week is $0.316.
Conclusion
The Pivot Point indicator is a very simple indicator to use. It is based on support and resistance points. It is very useful, especially in short-term periods. Because the prices used for the emergence of the indicator belong to the previous day.
It is useful to follow the 2-day trend while using the indicator. Also, the 15-minute candlestick schedule should be considered. As with all indicators, this indicator does not give 100% accurate results. Sometimes it can give misleading signals. In periods when the asset price is at the Main Pivot level, it is necessary to be careful to follow the direction of the market. We should also use stop loss while using this indicator.
Twitter sharing
https://twitter.com/Steemtht/status/1400476008332075010
Hi @tht
Thank you for joining The Steemit Crypto Academy Courses and participated in the Homework Task.
Your Homework Task verification has been done by @Stream4u, hope you have enjoyed and learned something new.
Thank You.
@stream4u
Crypto Professors : Steemit Crypto Academy
#affable
Thank you.