Crypto Academy Season 2 Week 2 Homework Post for (@stream4u) - All About Price Forecasting.
Professor @stream4u has shown the finest details of price prediction this week. I read the professor's course article at least twice to get a good grasp. I did my research and now I'm writing my homework.

What Is Price Forecasting?
It is to predict the price of the assets by considering the mind, intuition and some data. Price predictions can be daily, weekly, monthly, quarterly and yearly.
Estimating the price is important because it sometimes protects us from losses and sometimes it allows us to make more profits. Or, if we are to keep an asset for a long time, we can increase the number of assets 2-3 times with the buy-buy method based on the price estimation. We can also sell our asset at a long-term target price. It makes no sense to keep an asset for a long time. Based on the price estimation, we should increase the number of assets with the buy and buy method.
Price predictions are generally made in 3 ways. There are 3 methods: Basic, Technical and Sentimental. Some traders estimate the price with one method, while others estimate the price with 2 methods, some with 3 methods. The most accurate one is to estimate the price in our field of expertise with the method we are most efficient in.
Fundamental Analysis
In the fundamental analysis method, it is not important for traders what the asset price is at that moment. Factors such as asset-related developments, studies, strategic partnerships are looked at. For example, the fact that PayPal, which is an online payment method, started trading Litecoin is an example of a basic analysis. In this case, when making Litecoin price prediction, we can predict that the price of Litecoin will increase. The SEC's suing Ripple and the Coinbase exchange delisting XRP are another example of fundamental analysis. In this case, we can predict that the XRP price will decrease while making a price prediction. We make our moves accordingly.
Technical Analysis
In the technical analysis method, traders examine the charts of the asset. While analyzing the chart, it considers many formations. For example, if there is a double bottom pattern in the chart about the asset, the trader predicts that the asset price will increase after a while and makes his move accordingly. When a double top pattern occurs, the trader predicts that the asset price will decrease and makes a move in that direction. Support and resistance levels are also important. A trader ideally buys the asset at the support price and sells at the resistance price. Resistance or support can sometimes break and lose, but the ideal is to sell or buy at the support and resistance levels.
Sentimental Analysis
Issues related to fundamental and technical analysis are not taken into account in the emotional analysis section. There is a panic or fomo effect. It is possible to make a profit, but it is not a professional method. Merchants act according to people's opinions.

Discuss on why Price Forecasting is needed?
Traders all trade to make a profit. I don't think you are a trader who buys or sells to make a loss. As a trader, you should make price predictions if you don't want to lose or want to make less losses, if you want to make a profit, or if you want to make more profits.
I talked about this a little bit in the previous question, but let me answer the question in detail through different examples.
The launch of a strategic partnership between the Tron foundation and Steemit in 2020 had a positive impact on Steem price. This is a good example of fundamental analysis. A good trader makes a purchase when he first hears this news, and sells when the price reaches the level he wants. Here the trader made a profit starting from fundamental analysis.
Delisting any cryptocurrency from a major stock exchange is a negative development for cryptocurrency. This development means that there will be a decrease in the cryptocurrency price. You can immediately sell that crypto money and reduce your loss even more. The trader here reduced his loss based on fundamental analysis.
It is important to make a price prediction based on technical analysis. In technical analysis, it is important to be able to identify support and resistance points. For example, suppose the support price of an asset is $ 1.25 and the resistance level is $ 1.60. For a while, the cryptocurrency price will be at $ 1.20 - $ 1.65. A good trader buys cryptocurrency at $ 1.25-1.30, sells it at $ 1.60-1.65. If the coin price drops back to the support level, the trader should buy from here, sell again at the resistance level. Here the trader made a profit by predicting prices through technical analysis.
Keeping crypto money long term is not a correct method. Even if you want to keep a crypto money for a long term, you need to increase the number of cryptocurrencies you have by making a buy and buy transaction based on basic, technical and emotional analysis. Of course, you need to improve yourself in fundamental, technical and sentimental analysis.
What Methods are best you feel for Price Prediction/Forecasting.
I make my moves according to basic and technical analysis in price prediction.
I sometimes make price predictions based on fundamental analysis. I must be one of the first to know about the developments in cryptocurrency, because the first person to be aware of the development buys the price at the lowest level and earns more. Sometimes I use fundamental analysis to further reduce our loss rather than gain. For example, I was one of the first to learn that EOS co-founder and CTO Daniel Larimer had resigned. I owned EOS, predicted a drop in the price of EOS, and sold the EOS I owned, reducing my losses.
I often use technical analysis for price estimation. I had no knowledge of technical analysis before. Through professor @ stream4u, I learned support-resistance levels, double top-double bottom formations and many technical analysis topics. I sell cryptocurrencies that I want to own in the long term at the resistance levels, I buy them again at the support levels. With this method, I managed to increase the number of cryptocurrencies I have a lot. Since I am not confident in technical analysis yet, I make my moves without taking too much risk.
Take any Crypto Asset Chart graph and explain how to do Price Forecasting? OR Take any Crypto Assets Chart graph & as per its current price tell us what will be its future price for next 1 week or 1 month? You can predict for any direction up or down but explain it properly on what basis you have predicted the price.
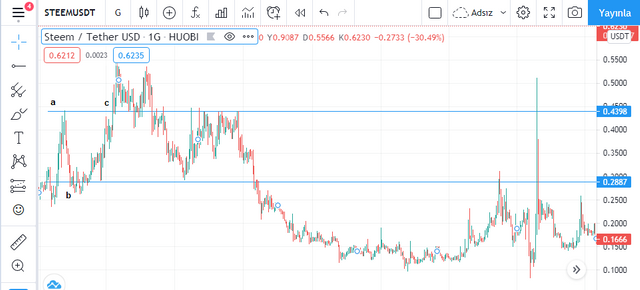
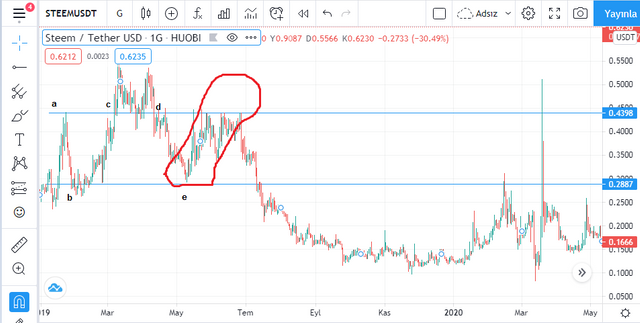
(Tradingview Steem / USDT chart)
Where I have shown in (a) the Steem price rose to its best possible level and then faced selling pressure. Steem, which climbed as high as $ 0.439, dropped to $ 0.288 at point (b). Steem price did not drop any further in that area because it faced the support zone in that area. We learned that the support zone is important for a cryptocurrency. Usually, the cryptocurrency price drops to the support price. An experienced trader immediately notices this area and makes a purchase.
Steem price starts to rise after accumulate at that level for a while. Steem price meets resistance at point (c), but with a strong buy it breaks the resistance level. The ideal would be to sell Steem at point (c). Because that area was the resistance zone before the strong buy. The level of resistance is now starting to be the support level.
Should we sell in this area or should we continue to keep it. This actually depends on the situation. A trader who sells Steem can buy Steem again at a slightly more expensive price as the resistance level is exceeded, and sell Steem in the resistance zone. Another suggestion. The trader selling a steem should wait for a while. It can wait for the support level to break.
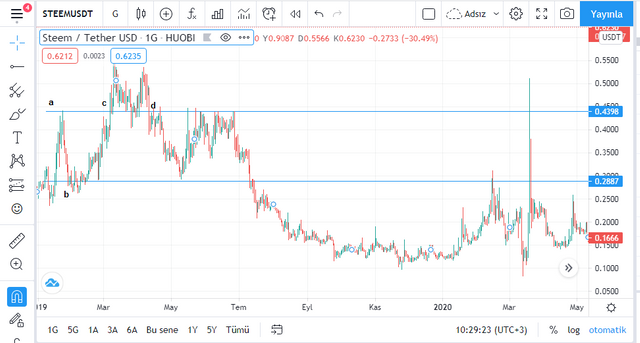
(Tradingview Steem / USDT chart)
Where I showed with (d) the new support zone is broken. It faced strong selling pressure as the support zone was broken. The trader who sells steem is a little more patient and can buy Steem for his price at point (b). The trader who sold Steem at the price of $ 0.439 bought Steem again at the price of $ 0.288 and increased the amount of the Steem he owned!
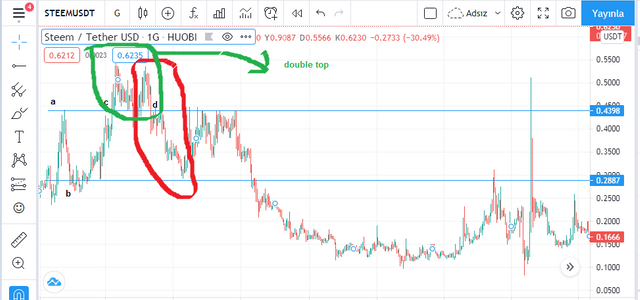
(Tradingview Steem / USDT chart)
Steem price dropped sharply here because of the formation of the double top pattern. We learned that the price of cryptocurrency will face a sharp decline in the double top formation. An experienced trader will notice this formation and sell his Steems.
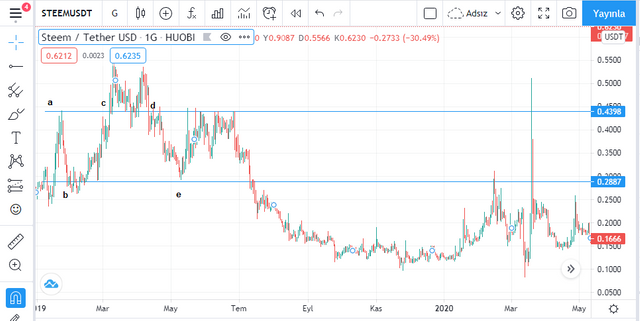
(Tradingview Steem / USDT chart)
Steem price dropped to where I showed it with (e). Because this is equal to the support level at (b).
(Tradingview Steem / USDT chart)
A trader who bought Steem at the $ 0.288 support level could sell it at $ 0.439.
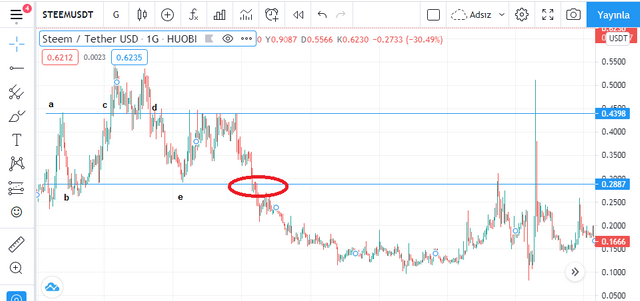
(Tradingview Steem / USDT chart)
The support zone is breaking where I marked. There is a sharp fall. Steem's new support level is changing. Steem's former support level turns into resistance as you can see on the chart.
Conclusion
Estimating prices helps us increase our earnings and reduce our losses. It is possible to make price predictions with fundamental analysis, technical analysis and emotional analysis. We should make price predictions based on the analysis method we are the best.
Thank you to Professor @stream4u for this helpful course.
Hi @tht
Thank you for joining The Steemit Crypto Academy Courses and participated in the Week 10 Homework Task.
Your Week 10 Homework Task verification has been done by @Stream4u, hope you have enjoyed and learned something new.
Thank You.
@stream4u
Crypto Professors : Steemit Crypto Academy
Thanks for checking my homework. I wish you convenience in your work.
Twitter sharing
https://twitter.com/Steemtht/status/1385518046580719616
Congratulations! Your post has been selected as a daily Steemit truffle! It is listed on rank 24 of all contributions awarded today. You can find the TOP DAILY TRUFFLE PICKS HERE.
I upvoted your contribution because to my mind your post is at least 9 SBD worth and should receive 50 votes. It's now up to the lovely Steemit community to make this come true.
I am
TrufflePig, an Artificial Intelligence Bot that helps minnows and content curators using Machine Learning. If you are curious how I select content, you can find an explanation here!Have a nice day and sincerely yours,

TrufflePig