Strategy and use of Donchian Channels - Crypto Academy / S5W1 - Homework post for @ lenonmc21

1.Explain and define in your own words what the Donchian Channels are?
Donchian channels were constructed by Richard Donchian.
The Donchian Channel Indicator is like of three lines which determine us and helps us show price movements, trend breakouts and it's reversals in the market and overbought and oversold conditions in the market.
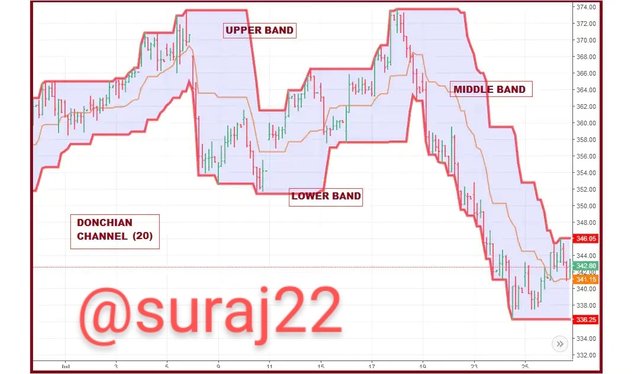
It consists of three different bands generated by the moving average calculation. The middle part of the indicator is the mid-range band. You also have lower and upper bands on the outside. The top one represents the highest price of the security, while the bottom one represents the lowest price. The band in the middle is the average of the other two. You calculate the value over a specific number of periods you set.
Traders apply Donchian channels to a variety of assets and time frames. It was originally intended to be used only on daily prices. Today, it is applied equally effectively to minute, hourly, weekly and other charts.
The Donchian Channels indicator is very common to Bollinger Bands.However, it also has its advantages. In many cases this proves to be the more suitable and easy-to-understand trading tool.
Keypoints:-
1.The indicator search to find out bullish and bearish increament that favor reversals as well as high and low breakouts, breakdowns and emerging trends.
2.The middle band is the average b/w the highest high over n periods and the lowest low over n periods.
2.Does it explain in detail how Donchian Channels are calculated (without copying and pasting from the internet)?
We can calculate Donchian channels by specified calculations of the upper band, lower band and mean median line.
The calculation is -
Upper Band:- Highest price in last n periods
Bottom Band:- Lowest price in last n periods
Middle Line:-(Upper Band-Lower Band)/ 2
n may have a different duration length depending on the time frame of the dimension under study – analogous as beats, hours, days, weeks, or months – and the duration will be the number of periods to be measured (30 beats, 24 hours, 20 days, 1 week, or 6 months).
Donchian channels take a 20- day of a trading period, which is the average of trading days in a month.
3.Explain the different types of uses and interpretations of Donchian Channels (With examples of bullish and bearish trades)?
When volatility is high, the indicator's bands widen. On the other hand, when the market is calm, and prices are more stable, the band narrows.
When the price reaches to the upper band, you get an overbought signal. If it touches the lower level, the market position is considered oversold. However, you should keep in mind that such scenarios are quite standard. This means that most of the generated signals are not informative in themselves.
Traders also rely on Donchian Channels to know about the strength of the trend. If the price moves into overbought territory or breaks the upper line during a bullish market, it indicates a strong trend. On the other hand, if it moves into oversold territory and breaks the lower band during a bearish market, the trend indicates that negative market sentiment prevails.
This pattern shows that the way the price behaves around the upper and lower bands can indicate both the start of a long-term trend and a reversal of the current one.
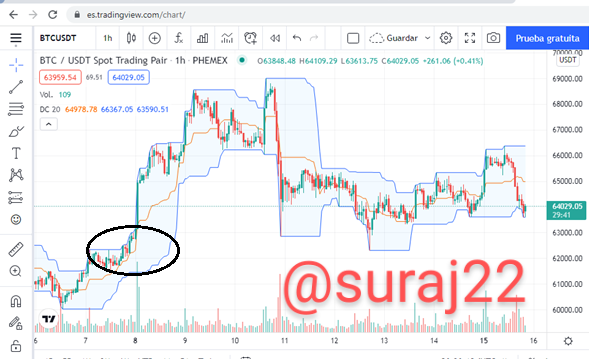
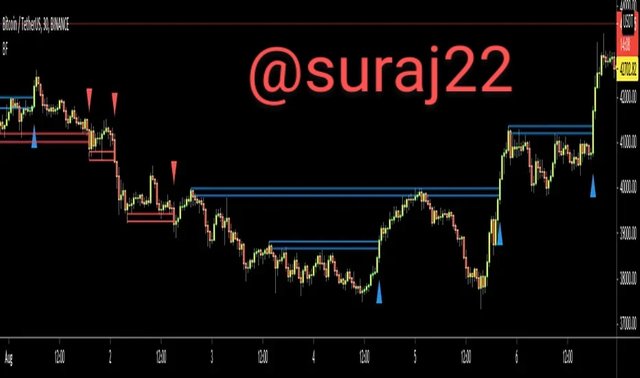
[Figure1 bullish breakout]
Source
The upward breakout of bitcoin is clearly shown in Figure 1 above. A volume candle emerged from the side zone previously marked by the Donchian channels, and a bullish rally began immediately.
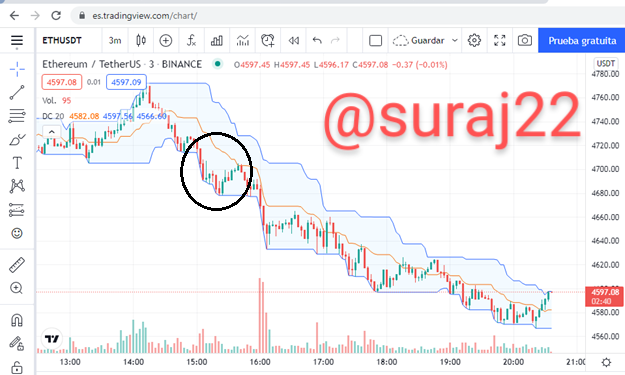
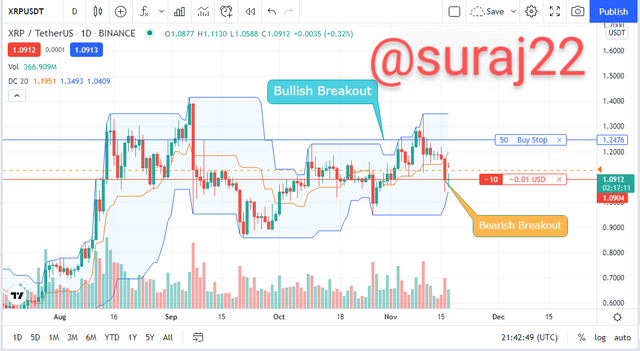
[Figure2 bearish breakout]
Then in figure 2 we can see Ethereum against Tether, where a significant uptrend was followed by a retracement that broke below the lower channel of the Donchian indicator, so a special downtrend was triggered to make a short decision.
Uses of donchain channel:-
1.volatility:-Channels are wide when prices are highly volatile and narrow when prices are relatively flat.
2.Breakout indicator:-Donchian Channels are usually used to findout breakouts of a stock or any trading unit so that helping traders to take long or short positions. Traders can take a long position, book their profit/short if the stock is trading above Donchian Channel "N" period and if DC is trading below channel "N" period.
3.Overbought and oversold: This is also a very simple explanation but very useful in some cases. The first thing we can say is when the price reaches the "Upper Band" there is a possibility of an "overbought" zone, if the price touches the "Lower Band", the opposite happens, in this case it is It is likely that we are in "oversold" territory.
Make 1 inning using the "Donchian Channel Breakout Strategy" and make 1 inning using the "Reversal and Retracement Strategy". You must explain the step by step of how you analyzed to take your entry and make them into a demo account so that I can evaluate how the operation was taken.
Donchian Channel Breakout Strategy is:-
Step 1 :-Firstly I log on to the Tradingview platform and select Paper Trading as my demo platform, then I start to select the Donchian Channel as my indicator, I set the indicator to 20 candlesticks.
Step 2: And, also on my chart, I choose a time frame of 15 days from which I could clearly see the trend activity over the last 15 days.
Step 3: I decide to enter the market when the market price was moving towards the lower band, placing a sell order of 10 xrp
Step 4: if the market price starts moving towards the upper band, I place my bought limit order, so as not to miss the trade luck.
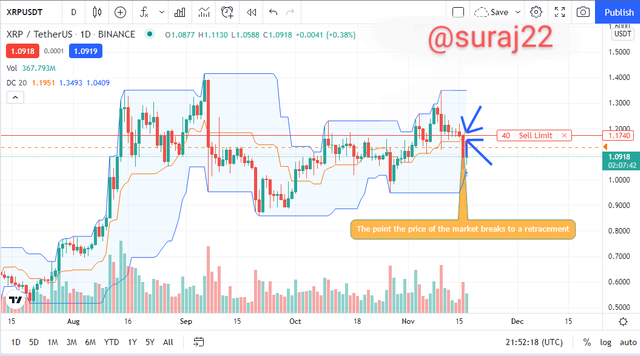
Reversal and Retracement Strategy:-
I proceed to locate the mid-band point where the market price crosses the lower band as the market is showing a bullish trend reversal, which I then use this analysis to take advantage of the market and I set a sell order for 50 XRP so as not to lose most of my assets to bear the market and at the same time reduce my risk.
Conclusion:-
This is very important lecture which enhance our knowledge about donchain channels.how it is so important for traders.thank you professor @lenonmc21 for giving a intresting and important lecture.
@endingplagiarism
This content appears to be plagiarised by @suraj22
In this homework, there are plagiarism content taken from here and here, piece by piece.
What???
Are you serious??
Can you please highlight the part which I have plagiarized or copied???
Are you aware of the irony in the use of an image I created, without my permission to highlight plagiarised content?
I edited my message.
It wasn't plagiarism for profit. It was something I did to support you in keeping with the rules of the site. Besides, I didn't think it was copyright. Any wa
Anyway, I made the necessary correction. Thanks for the warning.
I'm happy for you to use the image going forwards, just please be mindful when using images that others have created. Thank you.