" Steemit Crypto Academy | Homework Task 3 For @stream4u | What is Chart Patterns? | Price Breakout - Continuation Patterns - Reversal Patterns | STOPLOSS.
INTRODUCTION :
Hi steemains, hope you all are good. Today I'm inviting you to review my homework for task3 by @steem4u. Now I start my homework Task 3. In this task I will be discussing what arechart patterns , price breakouts, continuation pattern, reversal patterns and stop loss. With no further delay.
HOME WORK TASK 3:
- What Is A chart Pattern?
- What Is A Double Top Pattern? Explain with
one of the crypto coin charts where the Double
Top Pattern identified. - What Is A Double Bottom Pattern? (Explain
with one of the crypto coin charts where the
Double Bottom Pattern identified.) - In Investing & Trading What Is The Importance
of Stop Level(STOPLOSS)? - Where To Find & How To Set A Stoploss?
- What Understood From This Course?/
Conclusion.
ANSWER TO HOMEWORK-TASK 3:
Q1. What Is a chart Pattern?
It is the price formation of an asset which includes the history of the price movement of the asset, that available in different time frame are in chart. It is very important in technical analysis for trading as it is used to make BUY or SELL decisions in market . A trader always needs to understand and analyze the chart pattern before making the buy assets or sell assets decision. The chart pattern may be the continuation pattern and reversal pattern.
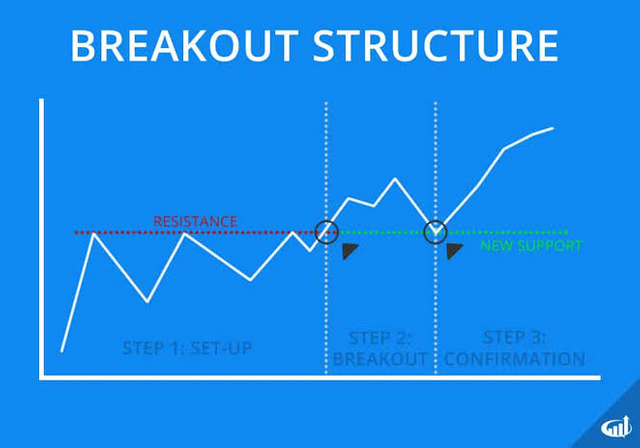
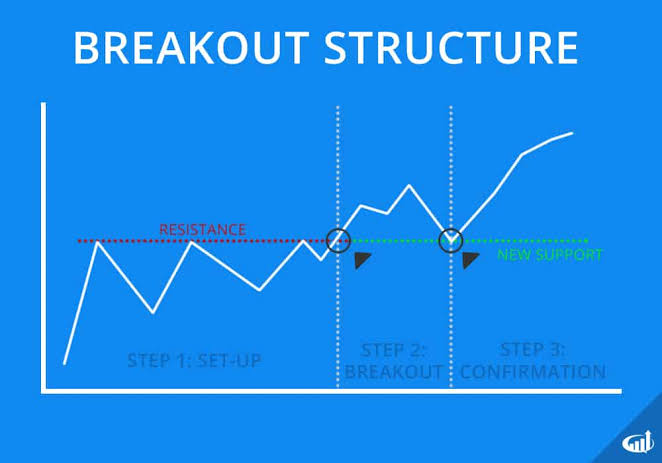
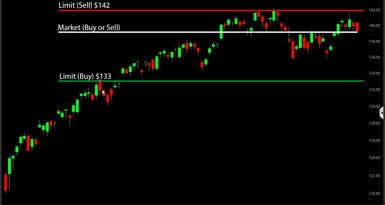
Q2. What is a Price Breakout?
A point at which the price movement of a crypto asset tend to move below the support or move above the resistance can be explained by Price breakout in cryptocurrency. There are two price breakouts; Resistance breakoutand Support breakout. A Cryptocurrency trader must know, that the support line of an asset is the point at which price goes up, opening a good level for buy and resistance line is the point at which the price of an asset drops which is the best level to sell.
Resistance breakout:
Resistance Breakout is a point at the which the price movement of an asset tend to move upward the resistance line. The prices at the breakout is indicated in the picture below.
Support breakout:
Support Breakout is apoint at which the price movement of the coin tend to move downward the support line. The screenshot given below has the prices at each level indicated on it.
Now we should discuss about entry levels;
Entry Level:
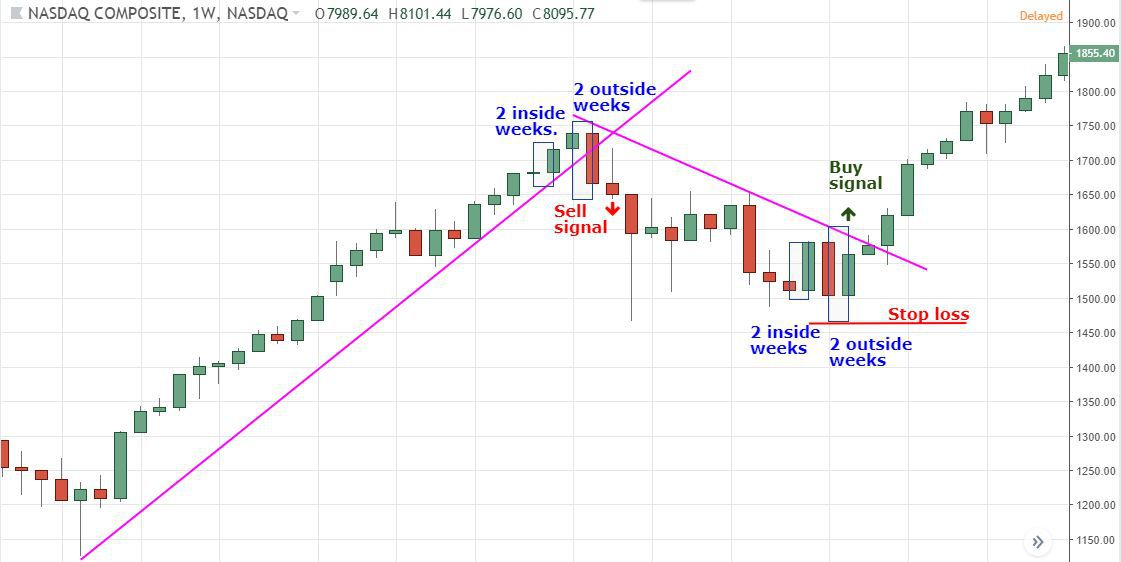
Entering a trade at a price breakout is risky and tend to be the fastest way to make quick profits in trading. If you must enter a trade in that level, it is important to consider the stoploss measure.
Stop Loss:
An exit from a trade is a point of Stop Loss. A time to make a decision to leave a trade after analyzing fall in price ahead. From the above screenshot (having the prices indicated on it), if you make your entry at the third support you must be ready to exit the trade at the first support and make sure the supports are closer to each other.
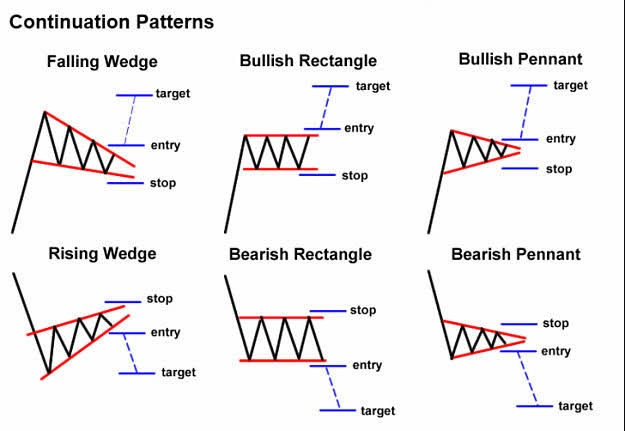
Q3. What is a Continuation Pattern?
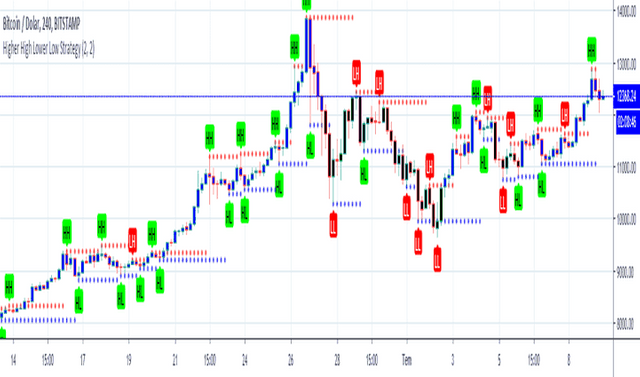
It is the chart pattern that indicates an asset will continue in a specific trend, either uptrend or downtrend,and in this chart pattern, collection of the price or retracements are done very fastly within the same going trend so that it's very hard to revealed that is there any change of trend occurring at any moment. The i continuation pattern on a technical chart can be checked out through the Higher High and Lower Low. The screenshots below shows the trend of the assets having the price levels on it.
Q4. What is a Higher High Formation?
A continuation pattern where the buyers command an asset price more than the sellers and take the the price of the asset back to the recent high is Higher High Formation.
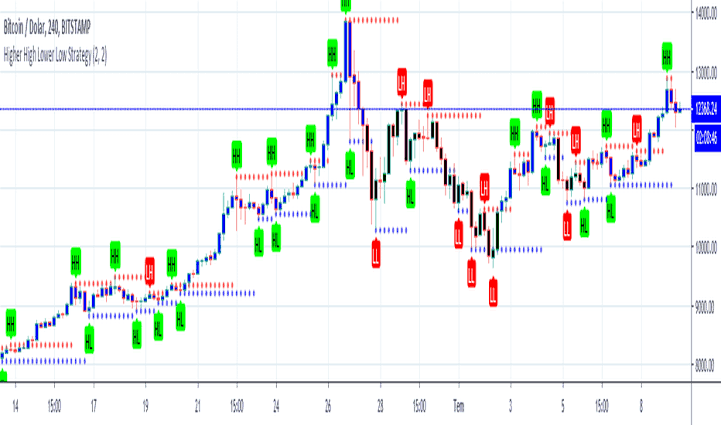
Q5. What is a Lower Low Formation?
the continuation pattern whereby seller command price more than the buyers thereby bringing down the price of an asset back to recent low is **lower low formation.
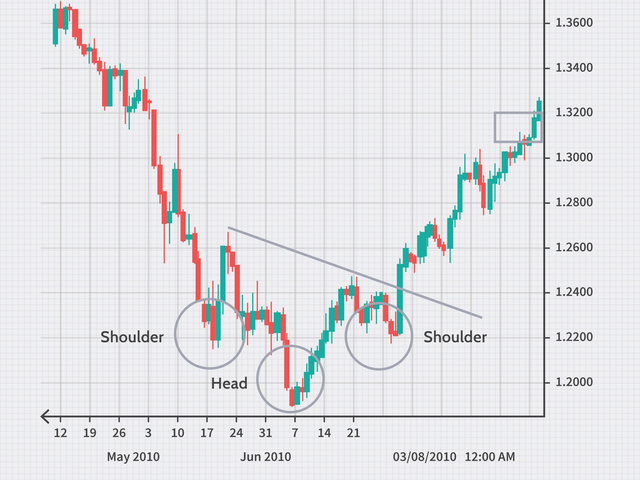
Q6. What is a Reversal Pattern?
A chart pattern which implies the end of a trend and the trend takes another direction is Reversal pattern. Example is a downtrend going back to uptrend.
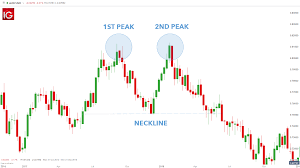
Q7.What is a Double Top Pattern?
Double Top Pattern:

Double Top Pattern is used for two high points but at the same level, it occurs when an asset experience a reversal pattern and in the process comes back to another high attained by the last movement, at the same level on chart.
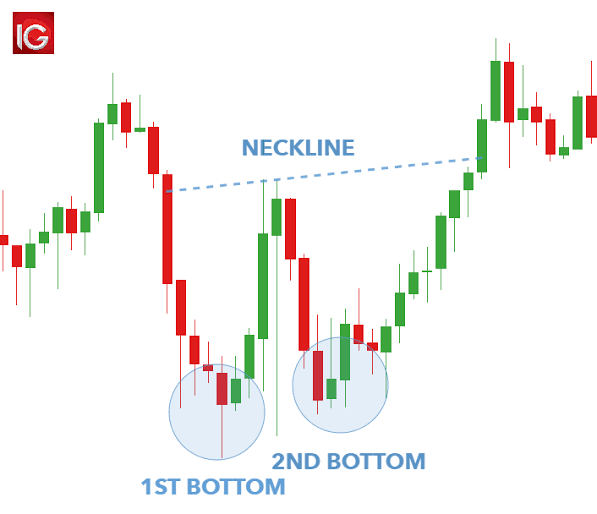
Q8. What is a Double Low Pattern?
Double Low pattern:
The two low points that occurred after a reversal pattern thereby bringing the two different price movement to a low at the same level is Double Low pattern.
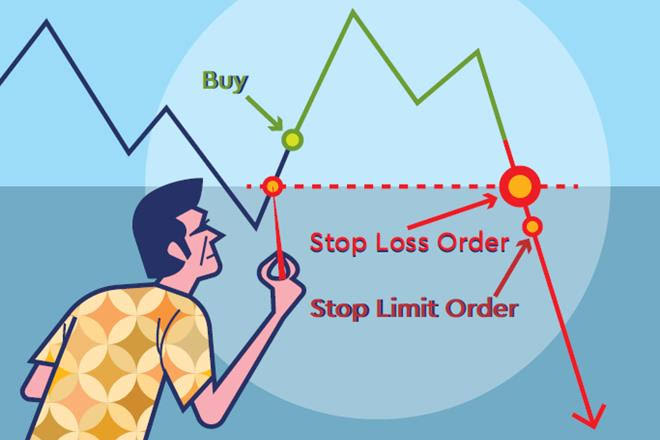
Q9. In Investing and Trading, what is meant by StopLoss?
StopLoss:

It is an exit from a trade. STOPLOSS is a time to take a decision to leave a trade after analyzing the fall in price ahead. From the above screenshot (having the prices indicated on it), if you make your entry at the third support you must be ready to exit the trade at the first support (first low) and make sure the two lows are closer to each other.
Q10. Where to find and how to use STOPLOSS?

To find the Stoploss use the support.
Stoploss are located by drawing a trend line for a initial support level in an asset chart, and wait for the price to come down but at mid way it stopped and the price moved up, draw another trend line and await another support to be happened . When the price comes down again, draw another trend. Making three lows altogether.
How use the Stoploss, use the third low to buy the asset of coin and make the first low to be your stoploss point.
You should be sure that the first low and third low are very close to each other. There will be great trading output with this.
Q11. Conclusion:
Now I can understand differences between the types of chart patterns and how they explain the history of price movement of asset coins and its application for technical analysis. Technical analysis is used to take decisions, when to buy and sell an asset, noting that it's not always 100% accurate but guarantees accuracy of buy or sell decision to an extent. I am now equipped with technical analysis that can help me to make decisions as to when to buy and sell an asset coins.
Thanks to the Steemit crypto professor @stream4u for his lectures and I look forward to learning more from the professor and other crypto professors of the @cryptoacademy. Thank you all for reading.
Special regards;
Cc: @steemcurator01
Cc: @steemcurator02
Cc: @steemitblog
Cc: @stream4u
Hi @suboohi
Thank you for joining Steemit Crypto Academy and participated in the Homework Task 3.
Your Homework task 3 verification has been done by @Stream4u.
Thank You.
@stream4u
Crypto Professors : Steemit Crypto Academy
https://steemit.com/hive-108451/@suboohi/steemit-crypto-academy-or-homework-task-3-for-stream4u-or-what-is-chart-patterns-or-price-breakout-continuation-patterns