Steemit Crypto Academy Contest / S14W2 - Volatility in cryptocurrencies.
Assalamualaikum everyone!
Welcome to the post. Hopefully, all of you will be doing well and enjoying the time with the grace and blessings of Almighty Allah. Today, I'm here to be a part of the week 2 contest in our beloved SteemitCryptoAcademy community. The topic of discussion is very much interesting, Volatility in Cryptocurrencies. So, let's start the fun without any wastage of time.
In your own words, how does volatility affect cryptocurrencies? Is it beneficial or detrimental.
We all know that the term 'volatility' is widely used especially in the cryptocurrency markets. Here, the term volatility means the huge changes in price of the assets with the passage of the time. In the first second, the market is moving up and in the very next moment it is moving down.
In simple words we can say that volatility is a term used to describe the extreme price changes of cryptocurrencies and other trading markets. This volatility can be a double-edged sword for investors, providing both huge rewards and potential drawbacks as well.
Is the Volatility Beneficial or Detrimental?
Volatility creates potential for huge gains in a short period of time. Investors who car bear high risks can earn significantly from these changes. Higher volatility draws more traders, resulting in a more busy market and thus improves the overall market value.
One more important thing to notice is that the volatility can also make innovation to mention the fundamental challenges such as scalability and security, resulting in a more attractive and impressive cryptocurrency ecosystem.

On the other hand, the same elements that might lead to substantial gains can also lead to significant losses. Price declines can harm the investor's capital or funds as the market moves very fastly and thus these fluctuations are very difficult to predict.
The high volatility of the cryptocurrency also make it very much risky so many of the companies and investors avoid investing in such markets as they have less risk tolerance. Most importantly, the volatility allows whales and other huge investors to manipulate the market, increasing price fluctuations and teasing smaller investors as well.
In short, we can say that the volatility of the crypto market is is debatable. While it offers large profits and make innovation, it also involves significant risks and thus harm the general acceptance. Volatility must be handled by different methods, such as more regulation, stronger market infrastructure, and enhanced investor education, for the cryptocurrency market to grow and reach its full potential.
Name and describe a technical indicator that measures the market volatility of an asset.
There are number of technical indicators that can be used to determine and measure the volatility of a crypto market. The most effective and the most commonly used indicator for me is The Average True Range (ATR). It is a famous and commonly used technical indicator for analyzing the market volatility of a cryptocurrency asset.
By doing some research work on the origin of this indicator, I came to know that It was created by J. Welles Wilder Jr. and is a strong instrument for spotting periods of high and low volatility, giving traders and investors with valuable prediction of the market and make wise decisions in the market.
Functions and Working...
The ATR indicator takes into account the real ranges of the market including the Current High, Current Low, Previous High and Previous Low, etc. Essentially, it records the widest price range during a given time period, which is usually 14 days. The ATR smooths out severe oscillations and provides a clearer view of the present volatility by averaging these real ranges across time by time.
The high ATR Indicates a period of high volatility, implying greater price swings and the possibility of larger profits and losses as well. While on the other hand, the low ATR denotes a time of low volatility, implying a more stable market with perhaps lower risks involved.
High ATR values can be used to detect potential breakout possibilities, while low ATR values can be used to identify potential support/resistance levels in the market. Based on the current volatility level, ATR can assist in determining the proper position size.
Another important thing is that to reduce risk, higher volatility should be handled with smaller position sizes, and lower volatility should be handled with greater position sizes. ATR can be used to set stop-loss orders at a safe distance from the entry price, limiting losses during volatile periods of the market.
Limitations of ATR:
There are some limitations of the ATR indicator, just like all the other technical indicators. Some of them are; ATR is a lagging indicator, like all technical indicators, showing previous volatility rather than predicting future behavior. Moreover, ATR measures volatility but does not indicate price movement direction. The interpretation of ATR data is timeframe dependent.
Describe the step-by-step to be able to include this indicator in the STEEM/USDT chart. You can use the Tradingview platform. Show screenshots.
The method of applying the ATR indicator on any market is quite simple. Let's discuss the steps one by one.
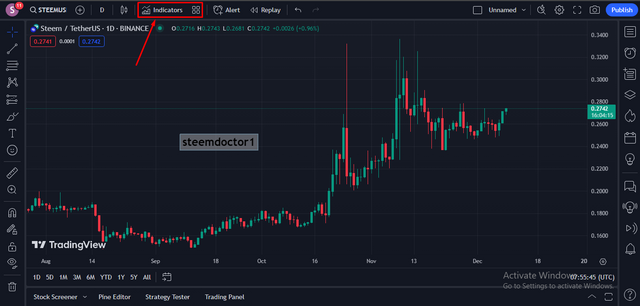
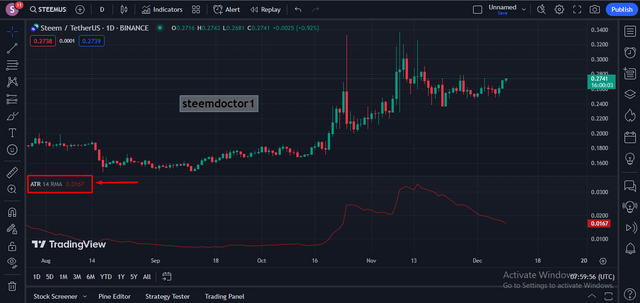
First of all, open the TradingView website and search the required market. I have selected the STEEM/USDT chart, as per the requirement of this challenge. After opening the chart, select the Indicators option in the top bar. This is shown in the below screenshot.
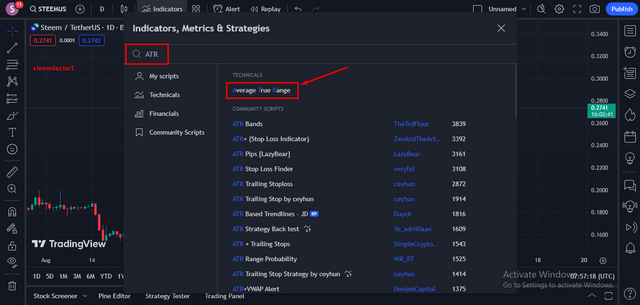
A pop-up menu will appear after selecting the option. Type 'ATR' in the search bar and you will see the Average True Range indicator in the list, click on it.
After clicking, you will be able to see the ATR indicator applied on the chart. You can also modify different settings of this indicator by opening it's menu. So, it's the simple method to apply the ATR indicator on the STEEM/USDT chart.
Explain in your own words, what happened to the volatility in the last month of the STEEM/USDT chart.
As I have already discussed that the ATR indicator is one of the most effective indicators to determine and measure the volatility of the market within the particular timeframe. Also, I have discussed the method to apply it on the STEEM/USDT chart. So, let's have a look on the indicator for the last one month, 9 November to 9 December.
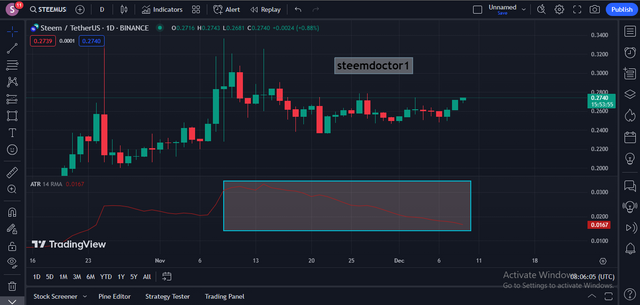
In the above chart, you can clearly see in the mentioned period of last month the volatility in the Steem market was on a constant decrease in the last month and it is still on the down side and it is expected the volatility will even decrease more in the upcoming days as well.
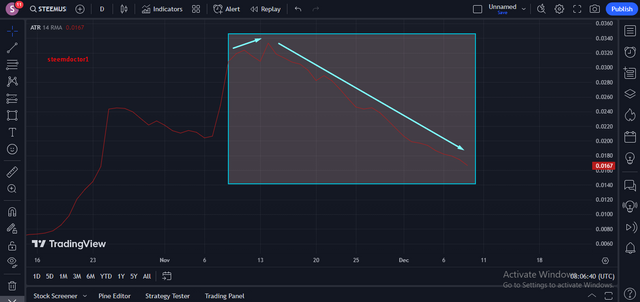
In the above picture, you can see more clearer view of the movement of the ATR indicator in the past one month. You can see that the volatility increases a bit at the start of the month and then it started decreasing on a constant pace. So, it is a complete explanation of the volatility of Steem market in last one month.
Do you think the future of cryptocurrencies is more stable? Give your own opinion.
We all know that the cryptocurrency volatility is a great character of it. However, whether cryptocurrencies' future will be more stable is a complex topic with no conclusive solution. It is determined by a number of factors and let ,e discuss some of the factors.
Scalability solutions, stronger security standards, and increased adoption amongst blockchains might all contribute to a more stable crypto industry.
Governments around the world might help to legitimate cryptocurrencies and minimize market fluctuations by issuing clear and consistent laws regarding cryptos.
Increased participation from large financial institutions could add credibility to cryptocurrencies and attract more and more investors.
As more and more individuals become aware of the merits and risks of cryptocurrencies, the market may mature and become less susceptible to huge fluctuations.
Keeping in view these points, it is difficult to determine whether cryptocurrencies' future will be more stable. However, I believe that the long-term trend will be toward greater stability and adoption. Cryptocurrencies have the potential to become a more widespread asset as technology advances and legality of crypto increases.
Some of the reasons for saying that are, as we are already observing that the scalability of the cryptos is increasing day by day and this thing can attract more and more users across the globe. Moreover, higher adoption, legal issuance, new projects are some concrete reasons to hope for the more stable future of the cryptocurrency markets.
Conclusions
Volatility is one of the important nature of the cryptocurrency market. The Average True Range (ATR) is one the most popular indicators which are used to measure and determine the market volatility. While the future is uncertain, I believe that cryptocurrencies have the potential to become a more stable and widespread market as a result of technology developments, more institutional interest, increased regulatory clarity, and enhanced investor education.
Note: All the screenshots are taken from TradingView website.
I would like to invite my friends @malikusman1, @sahar78, @suboohi, @aaliarubab and @artist1111 to be a part of this amazing challenge.
 |  |  |  |
|---|

I have learned alot about ATR as one of the main yard stick to measure the volatility of a currency
Upvoted. Thank You for sending some of your rewards to @null. It will make Steem stronger.
TEAM 4
Congratulations! This post has been voted through steemcurator07. We support quality posts and comments!Thanks for the support dear @radjasalman
@steemdoctor1 Your post on cryptocurrency volatility is truly informative and well-structured. I appreciate how you explained the concept of volatility in simple words making it easy for readers to understand. The choice of the Average True Range (ATR) indicator and the step-by-step guide on applying it to the STEEM/USDT chart using TradingView is a helpful addition for anyone wanting to delve into technical analysis.
Your detailed analysis of the STEEM/USDT chart over the last month supported by screenshots adds a practical dimension to your explanation. It's evident that you've put effort into presenting a balanced view of the pros and cons of volatility making the post insightful and comprehensive.
Your thoughts on the future of cryptocurrencies considering factors like scalability and regulatory developments reflect a thoughtful perspective
Thanks for such a nice comment. Stay blessed ♥️
Благодарю! Интересно подан материал!
Thanks 🤗
Greetings brother
Your insights about the volatility of crypto currencies are very clear and well written. Yes no doubt that the ATR indicator is very powerful and can be used to measure the market volatility. You have also explained about the working of ATR indicator by Applying it on the Steem/USDT chart. More ever you have also shared your positive thoughts about the future and stability of crypto currencies. Thank you so much for sharing a nice article with us.
Best of luck 🤞
Thanks a lot 👍
Hello brother.
Excellent explanation from your side about Volatility. You have explained everything in simple words which makes it easier to understand about this topic. ATR is one of the best technical indicator to be used to measure the volatility. Governments are adopting cryptocurrencies around the world and I believe It will help in providing stability to cryptocurrencies in future.
Great Post. Best of luck for the contest.
Thanks a lot for such a nice comment
X Share Link:
https://twitter.com/mrsheraz7588/status/1733411853227987367?t=CroWAmg3x_3yzy-OuxV63A&s=19
🔥$GULF Could Be Your Next Ticket To Financial Freedom 🔥
[🔥$GULF Could Be Your Next Ticket To Financial Freedom 🔥
https://steemit.com/hive-101145/@zeshanakhtar/usdgulf-could-be-your-next-ticket-to-financial-freedom