Steemit Crypto Academy | Course 4 By @stream4u | Support <----> Resistance | What is Technical Indicator? | Overview Of TradingView | 200 Moving Average.
Introduction
Hello guys, it's really a pleasure to me to be a part of these amazing home work given by our very own professor in the person of @stream4u. During these his last lecture, he clearly explained a whole lot on technical charts. And from they knowledge I have achieved from his lectures I will be working on the home work given. Please follow me as I explain everything in details as I have learnt.
Task Number 1
What Is The Meaning Of Support Can Become Resistance & Resistance Become Support, When and Where set Buy trade, Chart Example?
First and foremost I will like to remind us a few things among which is what is support and also what is resistance? A level which is attained by a price in a trading chart in which an asset will not fall or decline again is known as support. They support level experiences a very high buying activities. Whereas, a point in price that restrict any further upward movement of the price of an asset is known as resistance.
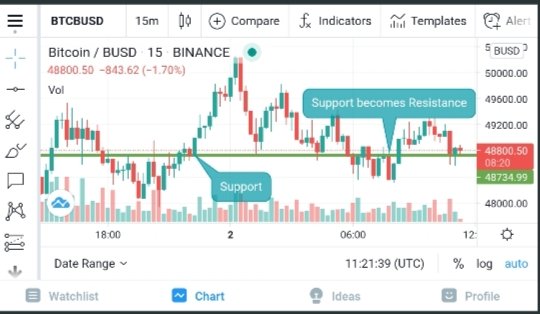
In a chart where we have a support line drawn, and the price drops below the drawn line and rise again we call that support becomes resistance. Once the price rises again to the previous line it is called resistance.
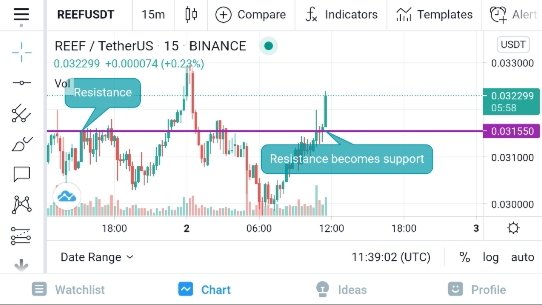
Whereas resistance becomes support only if the price of an asset rise above the initial drawn line of the resistance. Once the price drops again, the line is termed as support.
Task Number 2
What Is A Technical Indicator? (You can explore it as much as you can, like explain its role, show anyone technical indicator from your chart and name of that Indicator.?)
Technical indicators are indicators that allows you as crypto currency user to understand the technical chart more easily. To understand the movement of a particular asset at any given time requires the knowledge of technical indicators. I will brief list as many technical indicators as possible that we use in carrying out these analyses.
- Accumulation/Distribution Williams ^
- Alligator ^
- Aroon Oscillator
- Aroon Up/Down
- Average Directional Index
- Average Directional Index Modified
- Average True Range
- Average True Range Adjusted ^
- Awesome Oscillator ^
- Bollinger Bands®
- Bollinger Bands %B ^
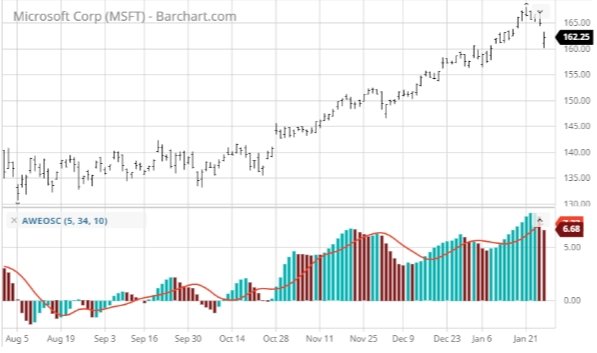
These are just few among other indicators but I will brief on a chart look at the Awesome Oscillator below is a screenshot of how the chat and it's indicators looks.
Task Number 3
Provide your view and explore TradingView.
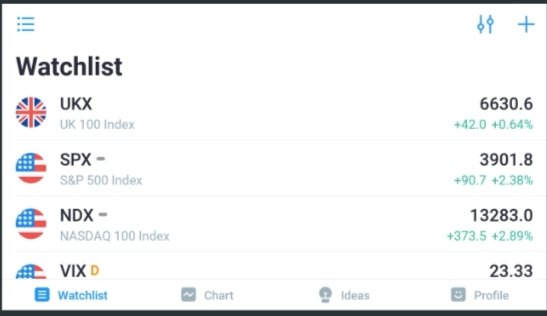
Trading view is an online charts application or portal, that gives traders and technical analyst the ability to share their trade idea.
It's important to mention here that these trade idea is not limited to just cryptocurrency but extends to Forex, stocks etc. Many tools are made available to help the trading such as the indicators and others. Analysing financial market have become a lot more easy because of the presence of the tradingview.
Task Number 4
What is 200 Moving Average, how and when we can trade/invest with the help of 200 Moving Average? Show different price reactions towards 200 Moving Average
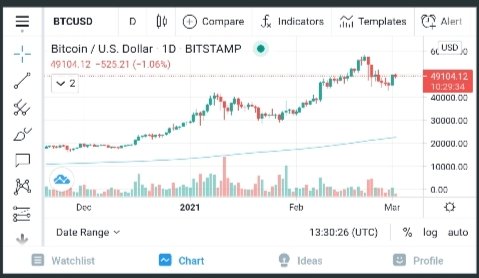
The 200 Moving Average (MA) can be seen as a trading indicator that averages the price data, and it appears as a line on your chart.
How and when to Invest or Trade with the 200 moving average
As earlier stated, 200 moving average is an indicator whose price data line appears on a chart. These enable the trader to understand exactly when to buy or sell. Considering both support and resistance on these content, we can say:-
Support — when ever a potential buying pressure in your chart is in place we then say it is support.
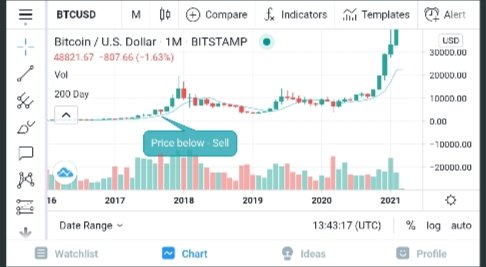
Resistance — same thing applicable here, when ever there is potential selling pressure in the chart we say it's a resistance.

Special regards;
Cc: @steemcurator01
Cc: @steemcurator02
Cc: @steemitblog
Cc: @stream4u-week4
Hi @simonnwigwe
Thank you for joining Steemit Crypto Academy and participated in the Homework Task 4.
Your Homework task 4 verification has been done by @Stream4u.
Thank You.
@stream4u
Crypto Professors : Steemit Crypto Academy
Thank you sir