Steemit Crypto Academy Contest || S15W6 - Chartist Analysis
1.- What is chartist analysis? And the importance of chart patterns.
- Chartist analysis firstly I will elaborate the term what it means this is actually the traders who actually use the chart or grass to see the prices to do future marketing.
- Or we can say this is the technical analysis indicator used for trading and for any research purpose to see the price by the use of charts and graphs.
- As we know for any technical analysis the single indicator is not sufficient so by the combination of so many indicators and the traders confirm it and making hypothesis.
So this is actually the combination of so many indicators sentiments and as well as different trading techniques to make sure for investment decision making abilities.
Chart patterns are used for so many reversal or continuous signals for example there are a lot of patterns which has been invented for the chartists so I am using a list of the chart pattern
These are some of the reversal pattern which I have mentioned
Double top reversal
Tripple top reversal
Head and shoulder
Double bottom reversal
So there are some continuation patterns as well for example
Triangle
Flag and pennant
Cup E handle
So there is another pattern which is called candle stick pattern and this is basically graphically shown of the price in the market so some of the common candlestick use pattern
Doji
Pin bar
Engulfing
Tweezer top
Chartist trading is playing a really important role for the traders and this is actually a very good technical indicator to identify when to make a decision.
So that decision making capability is improved so much by this indicator and in so many field of trading for example the cryptocurrency and other is a lot of other.
Another thing is which is really important that had traders are able to know about supports and resistance so this is basically tell you when to invest and went to sale your asset.
When you have good command on different types of charts and you have good and it's sending of it you are able to know different reversal and continuation in the market which I have already mentioned.
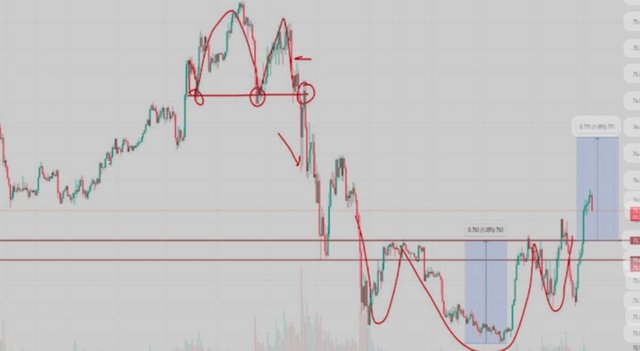
2.- What is the shoulder head shoulder pattern? Show screenshots using the BTC/USDT pair. You can use another cryptocurrency pair if you wish.
So firstly I would like to elaborate the term head and shoulder pattern aur simply we can say reversal pattern are reversal pattern is called the head and shoulder pattern as the name specifies the head means when in the pattern this is going up. The third thing which we see is the neckline which means this is a connection between two points.
So this is simple we can say in the middle is head and this is slightly in the peak among to shoulder. Shoulder and neckline have some differences according to market fluctuations.
So when the chart pattern is shown it means that there is a break down from the neckline and it means that the prices are breaking out.
- So there is another meaning of the this pattern it means that head is in the field and shoulders are in the middle and a neckline can be fluctuate or some how equal to shoulder are some what are going down or up so when we make this chart and we can make a prediction that the price will go below the level of neckline and in this way we can make this chart.
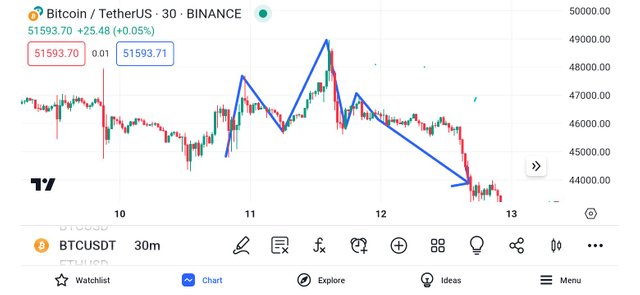
- This is I am using the Bitcoin and I have to screenshot at to show you so this is the 15 minutes time I am selecting and this is a proper example of head and shoulder pattern.
- The most important thing which I want to mention here is that there should be break of the neckline for the proper prediction of the price because neckline is the main important thing for entry into the market and when we see the neckline it means the price is going down and this is clearly showing in this graph.
3.- Explain the formation of the inverse head shoulders pattern. Show screenshots of a cryptocurrency pair that displays this pattern.
What is inverse head and shoulder pattern means that anything which is going down or in the negative direction is called the inverse head and shoulder pattern.
Now in this direction the things are going in words it means the shoulder will be in the up head is in the down.
It means that downward movement in the chart you can see.
So when we see this pattern we can see that when the chart is going down this is an indication for the buy order for the traders and this is just above the neckline.
Inverse head and shoulder pattern is the prediction of upward pattern.After the pattern is made the prices are going up.
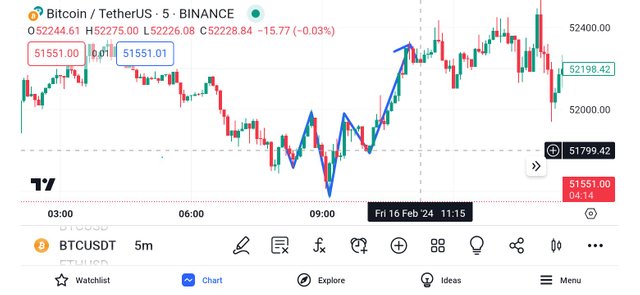
This is I am trying to showing another graphical presentation and I have took the screenshot so and this is 5 minutes graph this is classical presentation of the inverse head and shoulder pattern.
This is showing uptrend in the market I hope this graph everything is clear.
4.- For the technical analysis of the Steem, would you use chart patterns? Explain your answer
- So for that technical analysis of the steem I most of the time used chart pattern because this is very useful indicator for analysis and because it is very important to tell you about market fluctuations and this also tell you about went to buy and went to sale so yes most of the time when I need to check the market fluctuations I do use the chart for the steem analysis.
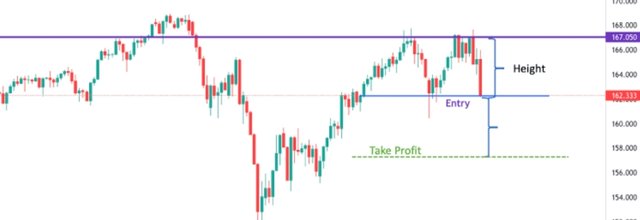
Double Bottom chart pattern
- So there are a lot of patterns actually we can get a while using steem/USDT so firstly I am going to elaborate by the use of this and to tell you about the double bottom chart pattern.
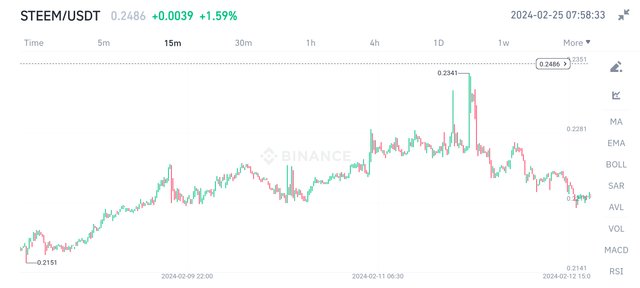
- So firstly I will tell what does it mean double bottom chart pattern this is actually when the market is going to up so this will show you double bottom chart pattern and or in simple word we can say that when the price is rejected two times and this is also an indication for bearish reversal.
Head and shoulder pattern
Another thing I am going to show you about head and shoulder person while the use of Steem/USDT
This is also showing the downward pattern of the market and I have already elaborated it in detail in my above post.

All of pictures I have taken screenshot none of this is my property
Upvoted. Thank You for sending some of your rewards to @null. It will make Steem stronger.
Thank you
Very good article, @shanza1. You have explained chartist analysis very clearly and communicatively. With your examples and images, your article is helpful to understand. Thanks and best wishes for this great information.
Thank you for visiting my post
Your most welcome 🤗
💜❤️❤️❤️❤️
Great breakdown of chartist analysis and its importance! Your detailed explanation of various chart patterns like double top head and shoulders triangles and candlestick patterns provides a comprehensive understanding. The screenshots with BTC/USDT pairs illustrating the head and shoulders pattern and inverse head and shoulders pattern are particularly helpful. Your practical application of these patterns in Steem/USDT analysis including double bottom and head and shoulders adds real-world relevance. Keep up
Thanks you so much for detailed review of my post stay blessed 😇
Greetings friend
You're very correct with this assertion.
You also mentioned and highlighted some other chartist patterns and how it works.
You also showed how to identify both the head and shoulder patterns and the inverted head and shoulder pattern can be identified on the chart.
Overall, your article was insightful.
You comment and kind words means alot to me ❤️❤️❤️
Dear friend
Just as normal you have written perfectly well I enjoyed every sentence you made me looking at your post it's obvious that you did put enough hard work and intense research come out to search excellent output as an article please keep doing the good work.
Please comment on my post too, thanks https://steemit.com/hive-108451/@starrchris/steemit-crypto-academy-contest-s15w6-chartist-analysis
Thank you for your kind words
Wow, @shanza1, you've really nailed it with your breakdown of chartist analysis and its importance! Your detailed explanation of various chart patterns, such as double top, head and shoulders, triangles, and candlestick patterns, provides a comprehensive understanding for everyone, even those who may not be familiar with technical analysis. The way you included screenshots with BTC/USDT pairs illustrating the head and shoulders pattern and inverse head and shoulders pattern is particularly helpful. It allows us to visualize and grasp these patterns more easily.
What's even more impressive is how you apply these patterns in your analysis of Steem/USDT. By incorporating examples like the double bottom and head and shoulders, you're showcasing the practical application of these chart patterns in real-world scenarios. This not only enhances the relevance of your analysis but also demonstrates your expertise in the field.
Oh my God that's tooooi much you say thank you so much friend you always support 💖💖💖
Great explanation of chartist analysis and the significance of chart patterns! Your breakdown of various reversal and continuation patterns along with candlestick patterns provides a comprehensive understanding. The details on the head and shoulders pattern, supported by the mention of key elements like head shoulders and neckline are well-presented. Using screenshots for the BTC/USDT pair enhances the clarity of your explanation. Keep up the excellent work in enhancing our knowledge of technical analysis..