SEC S18-W1 || Mastering the Markets with technical analysis
Hello everyone this is

I hope all of you will be fine and safe. Today I am happy to participate in such a contest which is my favorite topic. This is use of indicators in market analysis. These indicators play their role determining the move of market.
I would thank to @crypro-acadmey who arrange such an amazing contest. I am taking part in tag #cryptoacademy-s18w1 hoping for the best.
Now I will start my post.

Source
Indicators
Those tools which indicate the level or state of something.
Indicators are just like traffic signal in which each indicator indicates which one will be stopped,which one ready to go and which one is going.
In the same way indicators which are used in market analysis indicates the move of market is either upward or downward.We can assess the market using these indicators.But when there is a sudden crash or news than market will not follow these indicators.

Technical analysis is a basic or fundamental strategy for traders to assess the market trends,patterns and high trading opportunities in accordance with the historical data. We can make analysis using historical and this data is assesd by indicators , if we haven't any indicators we have to do this manually which leads to impossible situation of analysis. In this way we created these tools which are helping us in determining the technical analysis involves the study of past data in order to determine upcoming market trends.By using these indicators we can asses resistance, support , potential entry and exit points in market.
The main components of technical analysis;
- price charts
- Technical indicators
- volume to identify trends
- support
- resistance
Information from technical chart
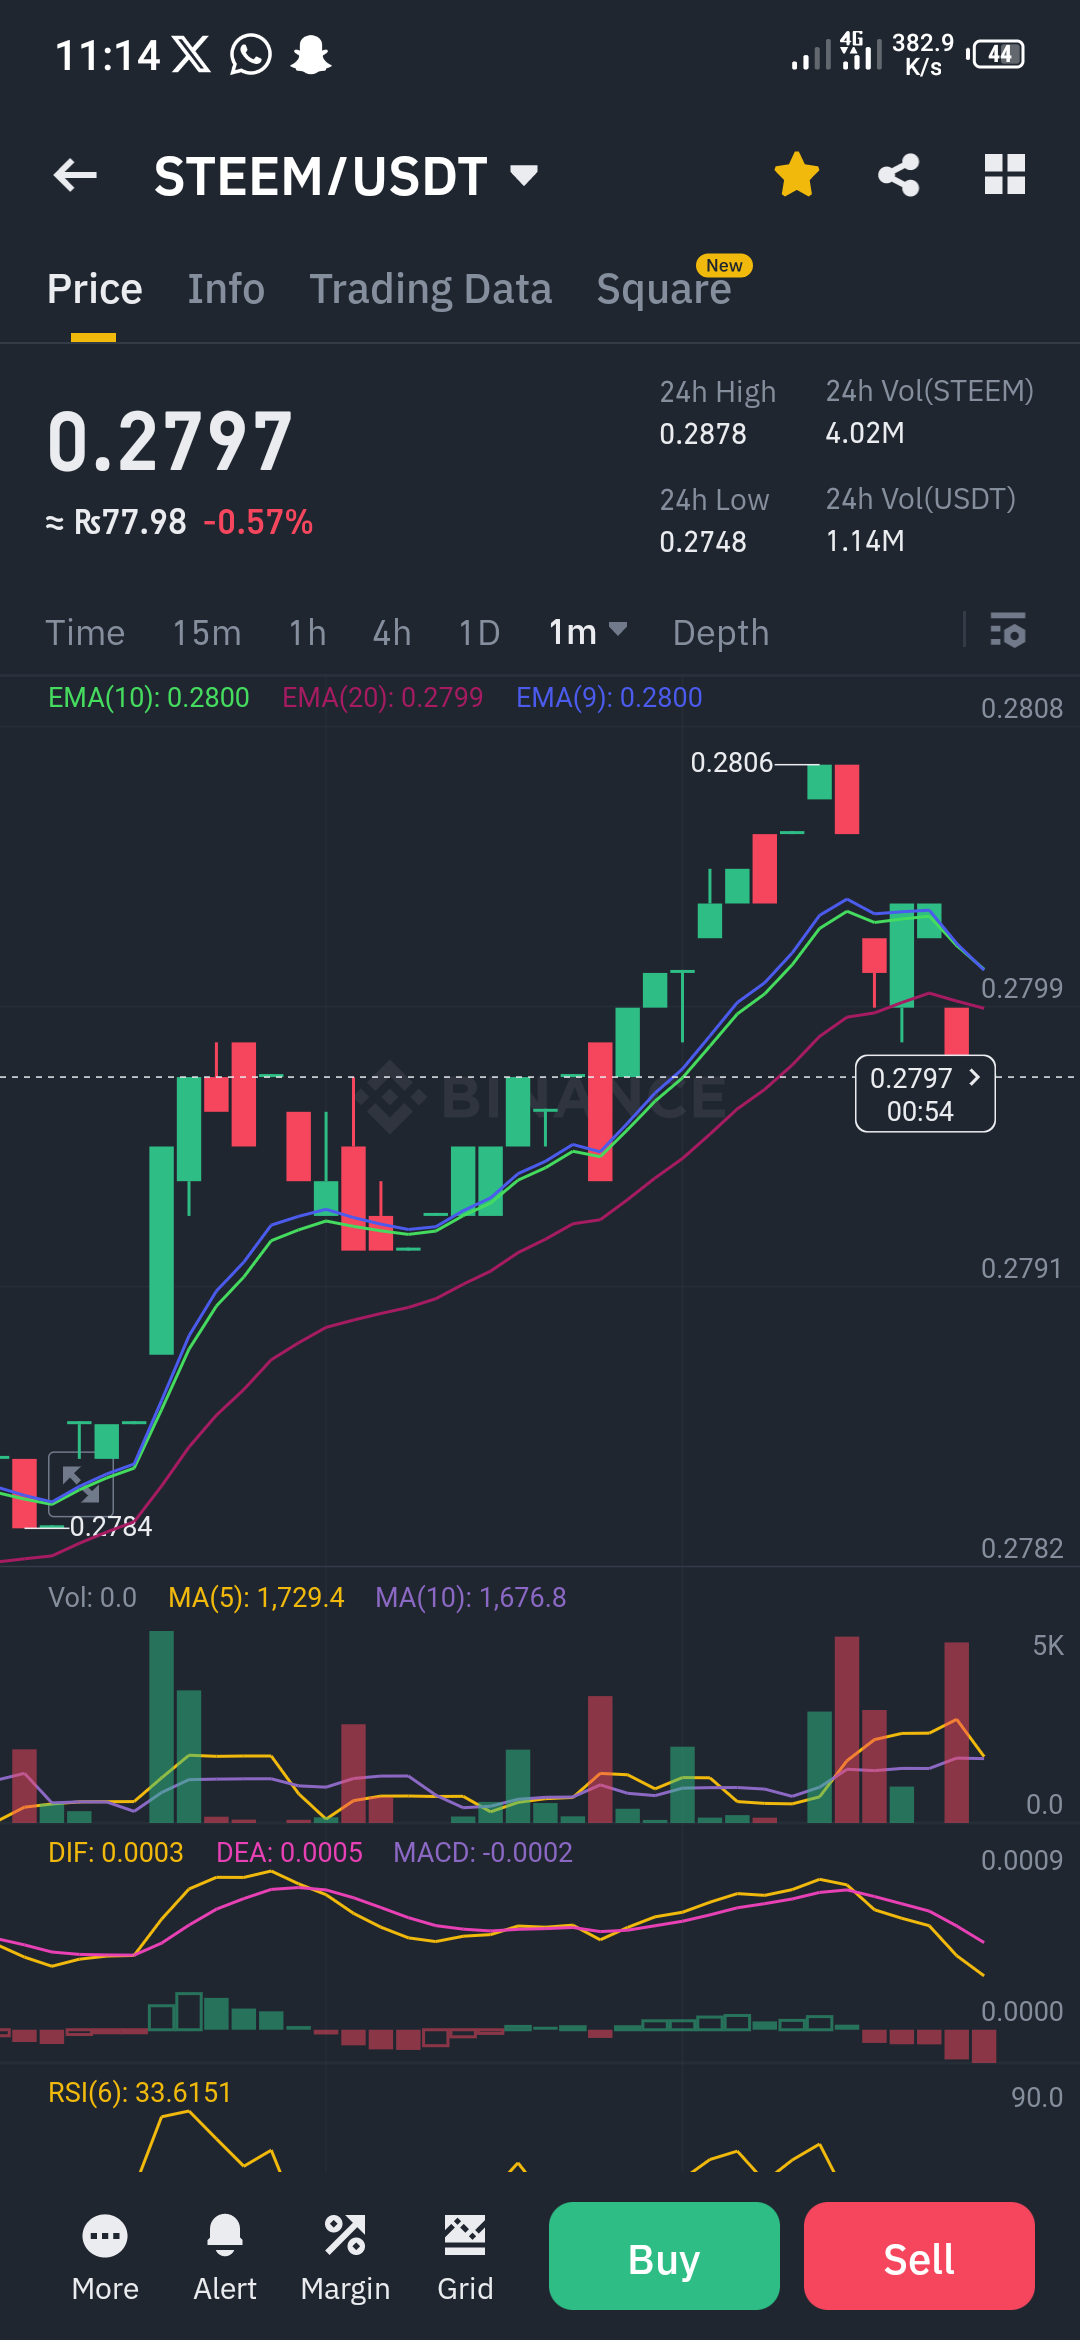
We can a lot of information from technical chart. We can get price of any coin. We can check the trends i.e either it is in upward trend or downward. Sometimes it is side way, when both demand and supply are equal. We can get the information of support and resistance information from a chart. There are many types of charts but we mostly use candle stick pattern.we can see shoulder pattern, triangles, inverted cup ,cup with handle, double bottom, double top and many more things. We can see the demand and supply, total volume of coin that has been traded within 24 hours of time. We can check or see various indicators. In short each and everything is on the chart just you need to do is use these tools wisely for success.
Candle stick chart display the open, close ,high and low of an asset.Each candle stick shows price action within the specific time frame .
A candle stick has following parts:

Source
Body
The wide part of the candle stick is known as body,this represent the price range from opening and closing.If the closing price is higher than the opening price this is showing upward trend and known as bullish.The color ofbody is green. In second Condition if the closing price is lower than opening price,the body of candle is red which indicates the bearish.
Wicks/shadows
The thin lines which are below and above the body of candle known as wicks or shadows.They are showing lowest and highest price during the time frame. One important thing is the highest point is resistance and lowest is support of candle.
Some important patterns of candles are ;
- Doji
- Bullish harami
- Bearish harami
- Morning star
- Evening star
- Inverted hammer
Significance of different time frames in trading
We use different time frames in trading according to specific type of trading.Time frames are in seconds, minutes, hours,days,weeks,months and years.
Now I will explain timeframe according to type of trading.
- Scalping
- Day trading
- Swing trading
- positional trading
Scalping
In scalping trades are taken for very short period of time and trades lasts for seconds to a minutes.For scalping those assets are selected whose prices are highly fluctuating. Because we are taking an entry for a few moments.Scalpers look for quick profits and in this way they have to invest large volume of assets.
Common scalping tools include tick-chart and one minute chart. They usually take advantage of gamma or Vega spikes and usually trade in segment option.
Day trading

This includes the trades which lasts for a day or less and end up all the trades at the end of the day.Day traders use intra day charts like 1- minute,5-minutes,15-minutes and other to find their opportunity and exit the same day.Traders started their trades in equity and futures and options in segments.
Swing trading
Aims to capture swings in price momentum over period of days to weeks.Hold trades for a short period of position lasts for 2to 4 days.
Positional trading

When trades are hold for weeks to month such trading style is known as positional require patience and hold for longer time.
In short scalping need more activity while other need patience.
Chart patterns are graphical representation of price movements of a particular asset in the market.They are formed by continuous movements of prices and such graphics are used to traders for traders.
Continuous pattern indicates that the current pattern will continue and move to same direction.
Reversal patterns indicate the reverse of patterns.
Continuation of patterns
Flags and pennants
These are short term patterns which occurs after a strong price movements.
Triangles
Triangles can be ascending, descending or symmetrical they indicate a consolidation phase before the continuation of previous trend. They indicate consolidation means static for some time and than again moved towards previous trend.
Channels
Channels are basically drawing of parallel lines along the lows and highs of price action , indication of continuation of trend.
Reversal patterns
Head and shoulder
This indicate the reversal of trend which is going to change the upward trend.
Double bottom and double top
Both these indicates the reversal of trend. When double top happens on the top this will shift momentum toward down trend.
When double bottom happens this will shift momentum from downward to upward.
Wedges
These are similar to triangle which might be ascending or descending.This indicate the reversal of trend.
Stop loss
Stop loss is based on the the resistance and support levels.
For example in case of long position the stop loss is the placed just below the support level.
In case of short position the stop loss is placed just above the resistance level.

Trading view is famous online platform which is used by the traders , investors and stock exchangers for their purposes.Trading view provides trading data,charts, technical tools. It provides us an opportunity to analyze market, price movements and all things which are important for trading.
In trading view we can apply variety of technical indicators.These are based on mathematical calculation.
These calculations are made using historical price data and volume, providing insights in to trends and other aspects of price behavior.
How we can use technical indicators?
- Selecting technical indicators
- customizing technical indicators
- interpreting indicator signals
- combining indicators
By following these steps we can use trading view in real time trading.
Support and resistance are key concepts in technical analysis.Support and resistance are of Great importance because these are the base rules.
The point at which maximum number of buyers are present acting as support. Support act as floor prevent the prices from further decrease.
While resistance is opposite to support.The point where a large number of seller are present act as resistance.This act as ceiling and stops the further increase in price.
We can determine support and resistance by using various technical indicators.
We combine indicators to get more good results.
We use following indicators .
Moving averages
Moving averages can act as moving support and resistance levels,with prices tend to bounce off them as they move high or low.
Volume indicators
Volume indicators can determine the strength or weakness of support or resistance levels by analyzing the trading volume .High volume ear support indicate buying and high selling near resistance indicate selling.
Pivot points are widely used in technical analysis as important factors in determining support and resistance around which price movements are expected to be pivot.These are reference point in determining the breakouts, potential price reversal,fakeouts and continuation of trend.pivot points are specifically more important in day traders because they analyze the data of previous day.
Now we will discuss importance of these points, calculation, importance and we can use them in trading.
There are several methods to find the pivot points but most common and important method is described below;
- pivot point =(High+low+close)/3
- Support 1 = (2× pivot) - high
- support 2= pivot - (High - low)
- resistance 1 =(2 × pivot) - low
- resistance 2= pivot +(high - low)
In this formula;
High= this is the highest of the previous day
Low= this is the lowest price of previous day
Close= this is the closing price of precious day
Significance in trading:
Pivot points are significant in trading because it provides essential information about potential price action.
These can be used to find support, resistance and breakouts.
We use these points for entry or exit.
Configuring and trading with pivot points;
- open trading site like binance or trading view
- note the high, low and closing price of previous day
- calculate the pivot points using the above formula
- determine the pivot points, support and resistance
Trading strategies for pivot points;
BREAKOUT TRADING
When a price breaks through a pivot points it often indicate the reversal or continuation of specific trend.Traders can get entry in the direction of breakout. Place the stop loss at pivot point and target at the next support or resistance.
Pivot points bounce
In this traders look for price bounce off pivot point.
When price approaches to pivot points from below traders mostly go for long. When price approaches to pivot point above mostly traders go for short or sell.
Pivot point reversal
This involves the looking for signs of price reversal around pivot points.
Traders can use additional indicators to confirm the reversal of price action.
Once reversal is confirmed traders go for opposite direction and place stop loss at pivot points.
I would conclude that if someone wanted to achieve something special in trading,he/ she must have basic knowledge of trading. I have tried my best to explain each and everything. If you find any flaws in it give your feedback. It will be appreciation for me.
I will invite friends
I am mentioning my friends @abdullahw2,@steemdoctor1,@radjasalman , @huraira50, @neelofar, @virajherath, @gsiscolors ,@rehman57,@heriadi
Achievement 1
https://steemit.com/hive-172186/@shano49/achievement-1-introduce-myself

Thank you so much 😊
Greetings my friend @shano49,
Your analogy of traffic signals for indicators is spot on! 🚦 So easy to understand and relatable. 😊 Keep up the great work!
All the best in the contest, success for you👍.
@artist1111 Thank you so much for your appreciation bro. I have tried to make things simple and understandable. I pleased that you approach me and make a lovely comment.
I will try my best to do more better in future.
Thank you for your best wishes ❤️
Thank you, friend!


I'm @steem.history, who is steem witness.
Thank you for witnessvoting for me.
please click it!
(Go to https://steemit.com/~witnesses and type fbslo at the bottom of the page)
The weight is reduced because of the lack of Voting Power. If you vote for me as a witness, you can get my little vote.
X promotion link
https://twitter.com/ZEESHAN59238556/status/1793170734627312008?t=2-UrPUau1mXiAAl6RfPsgA&s=19
I am very happy to read your post. You have explained crypto all basic tools very well. Your post has increased my knowledge a lot. You are doing a great job bro, keep it up.
@rehman57 thank you so much jnab for your compliments . Its my pleasure that you gave your review.
Yes tried to cover each and everything as much as I can. You know knowledge is a ocean which is limitless and no one can be master , you know masrers are also students of masters.
By the way thank you so much for showing such positive intent.
Assalamualaikum Zeeshan
Thank you for sharing your insights on the use of indicators in market analysis. Your explanation of technical charts and the importance of understanding support and resistance levels is very helpful. I especially appreciate how you explained candlestick charts and different trading time frames in a simple way. Its clear that mastering these tools is essential for successful trading. Good luck in the contest
@hamzayousafzai thank you so much brother for youe compliments.i have tried my best to elaborate things in simple way.Because the main purpose is understanding of things. If your content is fulfilling this demand than you have fulfill your purpose. Fear of failure will not bother you when you do things for the purpose of knowledge and understanding.
I have gave my 100 % the results depends on Allah Almighty.
Thank you for your best wishes
Upvoted. Thank You for sending some of your rewards to @null. It will make Steem stronger.
It seems like you're saying that understanding technical analysis is really important for traders. It helps them look at how the market has behaved before, so they can guess what might happen next and find good chances to trade.
You've made it clear that support and resistance are super important in trading. They're like the main rules that traders follow to know when to buy or sell stuff.
You mean pivot points are like important markers for traders. They help them figure out where prices might change direction, which is really useful for making smart trading decisions.
Good luck
@drqamu although you take some pieces of post but I am glad all the point are simple and picked by everyone.
Thank you for your best wishes ❤️
Hi @shano49
Your article supplies a strong intro to technological evaluation emphasizing its crucial elements plus value for investors. The description of cost graphes, technological indications, as well as candle holder patterns is clear as well as interesting. Including even more comprehensive instances as well as structured areas might additionally improve the viewers's understanding. Wonderful task in general!
@rajithpriyasad thank you so much for such lovely comment. I have tried my best to explain each and everything in detail. Now waiting for results hope so results might be good.
Again thank you for your besr wishes
Thanks for explaining how to use indicators in market stuff. Your breakdown of technical charts and why it's important to know support and resistance levels really helps. I like how you made candlestick charts and trading time frames easy to understand. It's obvious that getting good at using these tools is key to doing well in trading. Good luck in the contest.
@sahmie thank you so much bro for such splendid comment on my post. I thanked for your highly valuable words. I was not expecting such comment from you as you are the most highly reputated steemian. Its my pleasure that you read my post and not only read you also comment.This shows how humble you are.
I thanked you again ❤️