Steemit Crypto Academy Contest / S15W6 - Chartist analysis.
|
|---|
Hope you all are doing well and good and enjoying the best days of your life. This is me @shahid2030 from Pakistan and you are here reading my post. You all are welcome here from the core of my heart.
This is my participation in a contest Chartist analysis organized in SteemitCryptoAcademy by @crypto-academy.
1.- What is chartist analysis? And the importance of chart patterns. |
|---|
Chart analysis is very simple term trader use it for chart reading. Here the trader do their analysis and predict the future price of market. We use different technical tools to read our chart. Sometimes we analyse our chart through chart patterns, even we have candlestick patterns too, to analyze our chart.
Ofcourse chart patterns are too much important if you are a crypto, or forex or any other trader you must use chart patterns in your analysis. Charr patterns sometimes give to much accurate results. This is the reason many traders use it for their analysis. Some famous chart patterns I know are; head and shoulder pattern, double top, and double bottom pattern, triangle pattern and many more other.
Multiple times I have seen BTC respecting these Patterns. If we see BTC on daily or weekly chart we can see a double top pattern which was respected by BTC after making an all time high. From that double top we saw a huge dump in BTC price. Even it went down to to $15k level. It's hoping this time it will break that top after this halving event.
2.- What is the shoulder head shoulder pattern? Show screenshots using the BTC/USDT pair. You can use another cryptocurrency pair if you wish. |
|---|
A head and shoulder pattern is a too much easy pattern to understand. As it's name indicates it have a Head and two shoulders. It can be both, for uptrend or down trend.
How does head and shoulder pattern work?
First it makes a left shoulder, then make a top above that shoulder and come back from that top point. It doesn't stop there and go up again, but this time it doesn't cross the head, even it doesn't touch that point. It something goes half of the head point and come down again. Now it makes a neck Line and if this neck line is crossed, it indicates the price will dump. You can go for short Position. Same is the case for uptrend when it is formed in the bottom.
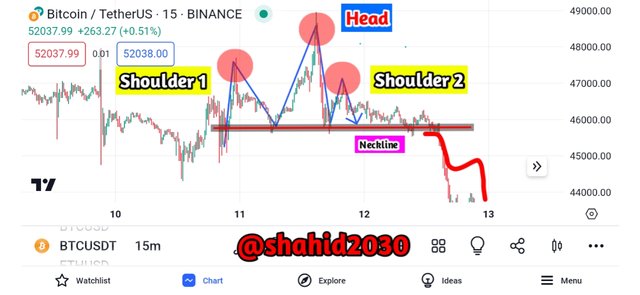
Head and shoulder pattern in BTC/USDT.
This is BTC/USDT Pair on 15 minutes time frame. Here you can see a perfect Head and shoulder pattern. Their is shoulder at left, then a raise in the price and then after that a shoulder at right side is made. Let me tell you that head and shoulder pattern isn't valid until the neckline is break. Here the neckline is broken through down side. You can see a dump in the price. The price went down after that.
3.- Explain the formation of the inverse head shoulders pattern. Show screenshots of a cryptocurrency pair that displays this pattern. |
|---|
Inverse Head and shoulder pattern is the opposite of Head and shoulder pattern. It's the indication of uptrend with us. The market goes upward after making an inverse Head and shoulder pattern. The structure is the same as heard and shoulder pattern, having two shoulders and a head, the difference is just it made at the bottom. The market goes up after breaking the neckline through upside.
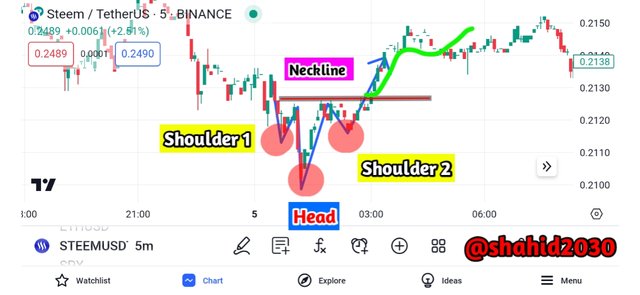
Inverse Head and shoulder pattern for STEEM/USDT Pair.
It's a proper inverse head and shoulder pattern for STEEM Coin. Here you can see the neck line has been crossed which is a confirmation to the valid inverse head and shoulder pattern.
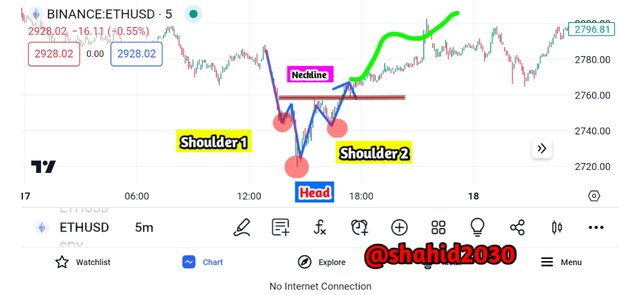
Inverse Head and shoulder pattern for ETH/USDT Pair.
This is ETH/USDT Pair chart on 5 minutes time frame. Here you can see a perfect reverse head and shoulder pattern. After the pattern is made a huge raise in the market is seen.
4.- For the technical analysis of the Steem, would you use chart patterns? Explain your answer |
|---|
Yes ofcourse I see chart patterns for STEEM analysis. Along with head and shoulder I watch other patterns too if Steemit price action is making. I follow them too. I have made a inverse Head and shoulder pattern for Steemit. Let me share a screenshot of some other patterns too.
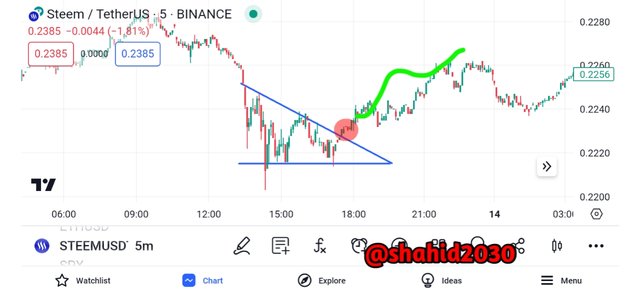
Decline Triangle
You can see a decline Triangle here. It's broken through upward direction and a raise in the price is seen. In every triangle the break through matter. If the break through is in upward direction, it continues an upward trend and if through down side, it a continuation towards the Down trend.
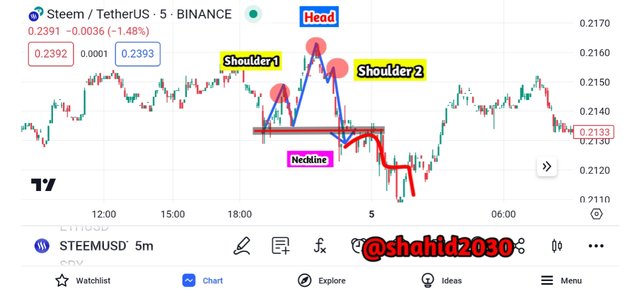
Head and shoulder pattern
This pattern is already been explained. It is properly followed and we have seen a downward moment after the break down of neckline.
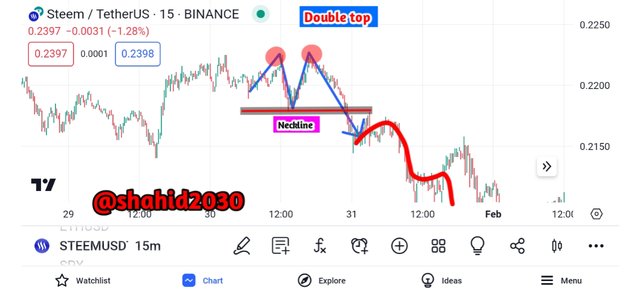
Double top
Double top is made where the price is going to dump. Here the the double is made, and after the break down of neckline we have seen a downward moment in the price of steem. We have a double bottom pattern too. I show us an uptrend induction.
This is all about my blog for today, hope you guys have enjoyed reading it. See you soon with a new amazing and interesting topic, till take care.

| I would like to invite: @goodybest, @ripon0630 @emsonic, @miyexi, @kouba01, @mile16, @pelon53 @solaymann @waterjoe , @willmer1988, @msharif to participate in this Contest |
|---|
Your presence here means alot
Thanks for being here
Regard shahid2030

Very good analysis Shahid brother. You have explained the important elements of chart analysis and analyzed various chart patterns correctly. Your experience and information makes your article stronger. Best wishes for you in this contest
Thank you so much dear for your precious comment. Keep blessing.
Your most welcome my dear . By the way you don't need to thanks always its my pleasure 💕
Upvoted. Thank You for sending some of your rewards to @null. It will make Steem stronger.
Thank you so much for the upvote too.
Thank you, friend!


I'm @steem.history, who is steem witness.
Thank you for witnessvoting for me.
please click it!
(Go to https://steemit.com/~witnesses and type fbslo at the bottom of the page)
The weight is reduced because of the lack of Voting Power. If you vote for me as a witness, you can get my little vote.
crypto market has the advantage of being able to analyze more. There are many types of tools and candlestick patterns that we can use to determine future price trends. One of them is Head and Solder. Head and Solder gives us information about market movements. Good luck to you. Bless you
Yes dear head and shoulder pattern is too much famous one in trading market. Thank you so much for your precious comment. Keep blessing dear friend.
Saludos cordiales gran amigo shahid2030, es un placer para mi saludarte y leer tu participación.
Excelente participación, te felicito porque manejas el tema muy bien, el análisis chartista es y será uno de los más fáciles de aplicar, pues la formación de figuras es algo ciclico y facil de ver cuando puede existir un cambio de tendencia.
Bendiciones.
My X Link.
https://twitter.com/Shahid00116/status/1759981021066346786?s=19
Greetings friend @shahid2030.
Your participation was truly exceptional, and I wanted to extend my heartfelt congratulations to you. The way you explained the topic with such clarity and expertise was truly impressive. Chart analysis is indeed one of the easiest techniques to apply, as it revolves around the formation of patterns that occur in cycles. These patterns can be easily identified, serving as indicators for potential shifts in the market trend. It's like recognizing the familiar signs of change in a repeating pattern. Keep up the fantastic work, and may blessings continue to come your way.
Thank you so much dear friend, your precious words mean a lot to me.
You have wrote so well and I must say your post presentation is outstanding and you have spent well time to write.
The clear definition of the head and shoulder pattern and this is very good for the beginners to understand.
The second important thing is the charting you have make clear presentation of the post
Thank you so much for your precious response dear friend.
Your welcome stay blessed friend
Dear Friend,
Chartist patterns is one of the forms of Technical analysis which we have. It is most atimes very accurate because it represents the current situation in the market.
The ones you mentioned like the double top, declining triangle are perfect chartist patterns.
You have written well my brother. Wishing you the best in this contest.
Thank you so much for your precious comment dear friend. Keep blessing.