Steemit Crypto Academy Contest / S14W5 -Exploring STEEM/USDT Trading
|
|---|
Hope you all are doing well and good and enjoying the best days of your life. This is me @shahid2030 from Pakistan and you are here reading my post. You all are welcome here from the core of my heart.
This is my participation in a contest Exploring STEEM/USDT Trading organized in SteemitCryptoAcademy by @crypto-academy.
Using the MACD, how can you identify a buy or sell signal for the STEEM/USDT pair? And what do the upper band and lower band in the Bollinger Bands for the STEEM/USDT pair indicate? |
|---|
Technical analysis
| MACD usage for buying and selling |
|---|
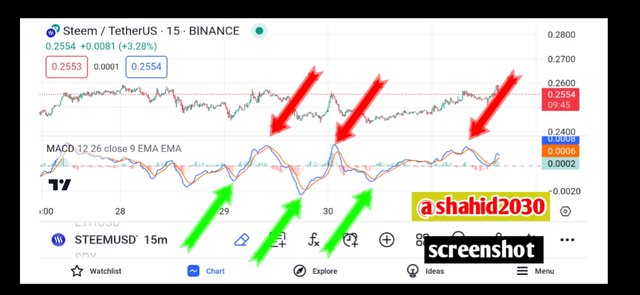
MACD stand for: Moving Average Convergence Divergence. It is a technical tool many traders use it for their analysis. Let's discuss it usage, how we can use it for buying and selling.
Buy Signal: We will have a buy signal when the MACD line crosses above the signal line. This usually means the price may goes up.
Sell Signal: We can indicate a sell signal when the MACD line crosses below the signal line. It shows us the bearish momentum. We will have a selling signal here.
| Upper band and lower band in the Bollinger band |
|---|
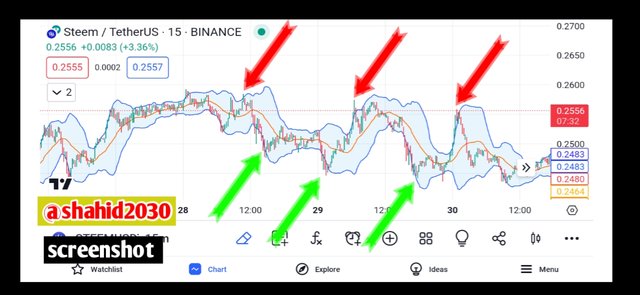
Upper band: It shows a level that is two times the average chage in price. If we see the price touches or go above this level it might mean they are to high and there is a possibility that it will go down or correct.
Lower bands: The lower band is the opposite of upper band. It shows a level that is two times less than the average change in price. If the price touches or drop below this level, it might mean it is too low and there could be a chace it will go up or bounce back from that point.
How can the combination of RSI and moving average help determine entry and exit points for STEEM/USDT? And how could a trader use the Stochastic Oscillator to confirm bullish or bearish trends in the STEEM/USDT pair? |
|---|
Trading Strategies
These are the different trading tools that can be used to analyze the price of any crypto or forex pair. Let's talk about these one by one.
The RSI stands for Relative Strength Index.Many traders use RSI and moving averages together for trading purposes in crypto market and forex market.
| RSI and Moving Average for Entry and Exit |
|---|
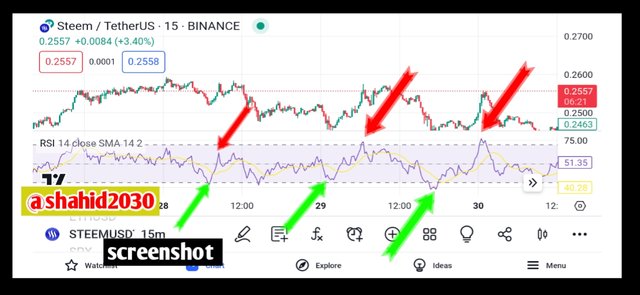
- Entry Points: Always go for buy signals when the RSI is below 30. It is indicating that market is in oversold conditions now. For moving average, when the price crosses above a short-term moving average, it suggest a potential reversal.
- Exit Points: When RSI is above 70,it will be considered as our selling or exist point. It indicates potential overbought conditions. Also, look for a crossover below a short-term moving average, if it happens take it as a signal to exit, suggesting a potential reversal.
| Stochastic Oscillator for Confirmation |
|---|
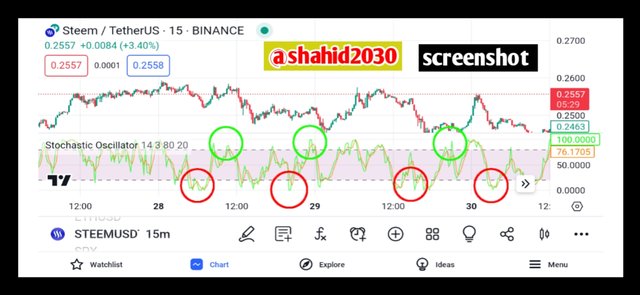
Bullish Trends: A bullish trend is confirm when the Stochastic Oscillator shows a crossover of its %K line above the %D line in the oversold region (below 20).
- Bearish Trends: Same a bearish trend will be confirmed when the Stochastic Oscillator shows a crossover of its %K line below the %D line in the overbought region (above 80).
Their is an advice with these indicators that we don't use them in isolation. We also look for other market factors and use some more confirmation from other technical analysis tools too. In crypt, more confirmation means, more accurate trading.
How important is a stop-loss when trading STEEM/USDT, and how can it be set based on technical analysis? Why is it essential to diversify positions when trading the STEEM/USDT pair? |
|---|
Risk management
Stoploss is too much important in crypto market. We place stoploss according to the situation. In technological analysis we find key levels. According to those levels we place our stop loss.
Let me explain it through example
We open our trades on the basis of two things, Support Level and Resistance Level. Now for example I am trading on STEEM/USDT Pair and I find out that, it has a major support at $0.24. I will try to keep my stoploss below it, somewhere 0.2380 and will open long trade.
Same for example I am going for short trade. I will find the resistance level. For example I find out that the major resistance level of STEEM/USDT Pair is $0.26. I will place my stoploss above $0.26 somewhere $0.2620 and will go for short trade.
| Diversifying of positions when trading the STEEM/USDT pair |
|---|
As we know that crypto is a highly volatile market. Diversification is the principle that can help us protect from any great lost.It is a key Principle in maintaining a balanced risk return profile. It may limit your huge profit in a single asset, but it also helps protect against significant losses. It contributes to a more stable and resilient portfolio.
Diversifying positions when trading the STEEM/USDT pair is also important. It helps us manage the risk by spreading investments across different assets. It works the same as in other crypto pairs. If we diversify STEEM/USDT pair we can protect against significant losses. Additionally, it can provide opportunities for gains in various market conditions.
The best example of diversification for me is doing Hedging, both in future trade or spot trading. We should buy or sell STEEM Coins stepwise. If market make any movement we can protect our portfolio. For example: Steem coin is at $0.24 and you want to buy at in spot. Invest 10% or 15% of your portfolio. If it goes to $0.26/ $0.30 you can simply book your profit.
However if market dump and steem price comes to $0.20, invest 10% more in steem coin. If it dump more to $0.16 then invest 7% more. Now if the market goes back to the old price which is $0.24 you will be in profit. All your lost will be recover and even you will be in profit at your old entry zone.
What fundamental factors should one consider before taking a long or short position in STEEM/USDT? and how can external events, such as announcements related to STEEM or stablecoins, influence the trading of the STEEM/USDT pair? |
|---|
Fundamental Analysis
The fundamental plays a very vital role in crypto market. I guess fundamentals are the news with too much surety and confirmation. For example if their is good news for the market, it's 99.9% confirm that the market will goes up. Same of their is bad News in the market, The market must will dump. I believe fundamental news are more accurate than Technical News. For me fundamental news accuracy is 99.9%, while market works hardly 85% on technical analysis.
STEEM related NEWS: Always focus the fundamental health of STEEM. Must follow its technological development, team program, partnerships, and community support. *** For example: News like, the launch of Steem 0.25 Hivemind update on Dec 15th. This is a fundamental news, which indicates positive developments. We may go for long position here.***
Other things like the upcoming events, such as, The SteemFest 2024; it's a great news, can create excitement within the Steemit community. The overall community sentiments should be checked. So these are all the possible news we should watch within the Steemit platform.
Now Let's talk about how external market can effects the price of STEEM Coin.
Market Conditions: The overall market must be under watch if the cryptocurrency market conditions is bullish or bearish, it should be noticed, as it impact all coins, including STEEM. Any great development in market can greatly effect it's price.
For example: The new of BTC Halving in April 2024 can have positive effect on the overall market. STEEM Coin will also get benefit of it. In market we can see extranal sources, such as; Tron, if it support Steemit, it can have good effects on steem coin.
So these are all the possible fundamental related to Steemit. It might be the internal factors or external.
Apart from commonly used indicators, what other leading indicator could be useful to analyze the behavior of the STEEM/USDT pair? and how can trading volume be interpreted to predict future movements of STEEM/USDT? |
|---|
Leading Indicators:
The best thing which I am always using for my trading is trend line. Trend line is the very simple, but too much authentic and valid way of finding trend or going for short or long. Same I am using it for trading STEEM/USDT pair to. We have three basic types of trends. Let's discuss it here one by one.
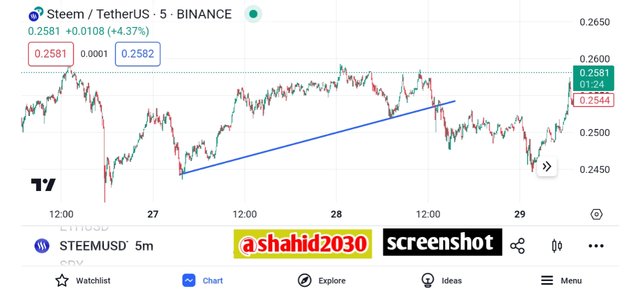
Up Trend: As the name indicates, in up Trend the market goes up or bullish. The market create Higher high and Higher Low in a continue way. At least we have two higher high and higher low then we can confirm an uptrend. This is the indication for buy or long position. Remember on thing if we have more higher highs and lows, for example more than five, then the trend will become weaker. Their is a chances of reversal.
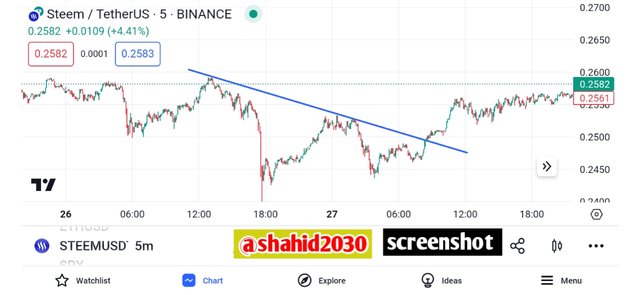
Down Trend: Down trend mean a bearish trend. Here the market makes Lower High and Lower Low. The rest it is the same as Uptrend. Here we can go for a short or sell position with a proper stoploss.
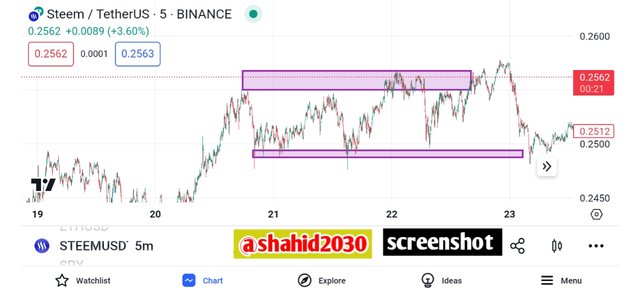
Side Way Trend: In This the market is in ranging position. It neither goes up, nor down. It has no higher high, Lower low or concept like this. It's a ranging market with in a specific zone.
| how can trading volume be interpreted to predict future movements of STEEM/USDT |
|---|
The trading volume has a direct relation with the price of STEEM. The more volume in market mean, more trades have done trading on STEEM/USDT pair, which is a good sign for STEEM and it can goes up. It shows the interest of people in the project.
Mostly the more volume bring positive news for the market, but yes the volume can also be increased in Sharp down trend, where everyone is opening a short trade. So more volume sometimes bring the market down.
This is all about my blog for today, hope you guys have enjoyed reading it. See you soon with a new amazing and interesting topic, till take care.

| I would like to invite: @goodybest, @emsonic, @miyexi, @kouba01, @mile16, @pelon53 @solaymann @waterjoe , @willmer1988, @msharif, @ripon0630 to participate in this Contest |
|---|
Your presence here means alot
Thanks for being here
Regard shahid2030

Thank you, friend!


I'm @steem.history, who is steem witness.
Thank you for witnessvoting for me.
please click it!
(Go to https://steemit.com/~witnesses and type fbslo at the bottom of the page)
The weight is reduced because of the lack of Voting Power. If you vote for me as a witness, you can get my little vote.
My X Link.
https://twitter.com/Shahid00116/status/1741523782580478300?s=19
Upvoted. Thank You for sending some of your rewards to @null. It will make Steem stronger.
Thank you so much for the upvote dear.
Hello friend, the RSI and MA can combine to give a great signal. Like you mentioned, the RSI levels 70 and 30, are great areas where price could be rejected.
However, it is always advisable to use the higher timeframes when doing so, to get a more accurate entry in addition to using the Moving Average.
Thank you so much for such insightful write up.
Wishing you the best in this contest.
Yes dear Thank you so much for your beautiful comment. Keep blessing my dear.
Hello my dear friend this is indeed a great entry and you have given the explanation to each and every question very clear and I know how much hard work behind making a crypto post is that I can understand and I think you have very good in this understanding of the crypto and then only you are able to write about this post.
Given a very detailed explanation about diversification and the example you have given I have read almost every article but I didn't see the explanation you have given I think you got score is well deserve and then you have deep knowledge of crypto best of luck
Thank you so much for the beautiful comment dear. Keep blessing always.
Aameeen
Excelente contenido amigo, bien preparado para hacerte entender. Desconocía la noticia de actualización del Steem 0.25 Hivemind el 15 de diciembre y tampoco del evento The SteemFest 2.024.
Sin duda la noticia que más impactará de manera indirecta pero fuertemente es el halving de BTC para el mes de marzo o abril, creo que desde ya las posiciones en largo se pondrán a tiro para esa gran escalada que todos esperamos.
Saludos y éxitos. ¡Feliz año Nuevo!
Happy New year brother. Thank you so much for your kind and precious response. Keep blessing.
Greetings friend,
You did a great job explaining how the MACD can help us know when to buy or sell. I also get what you mean about using the RSI and moving averages together for entry and exit points. Your explanation was detailed and the images made it easier to grasp.
You also made it clear how the Stochastic Oscillator can confirm if the market is going up or down. And your example of using stop-loss based on support and resistance levels was easily understandable.
You really emphasized the importance of diversification for managing risk, and your example of the hedging strategy was spot on. Good luck in the contest.
Thank you so much dear for the beautiful comment here. Keep blessing friend.